Published: 2025-03-11T13:22:18.000Z
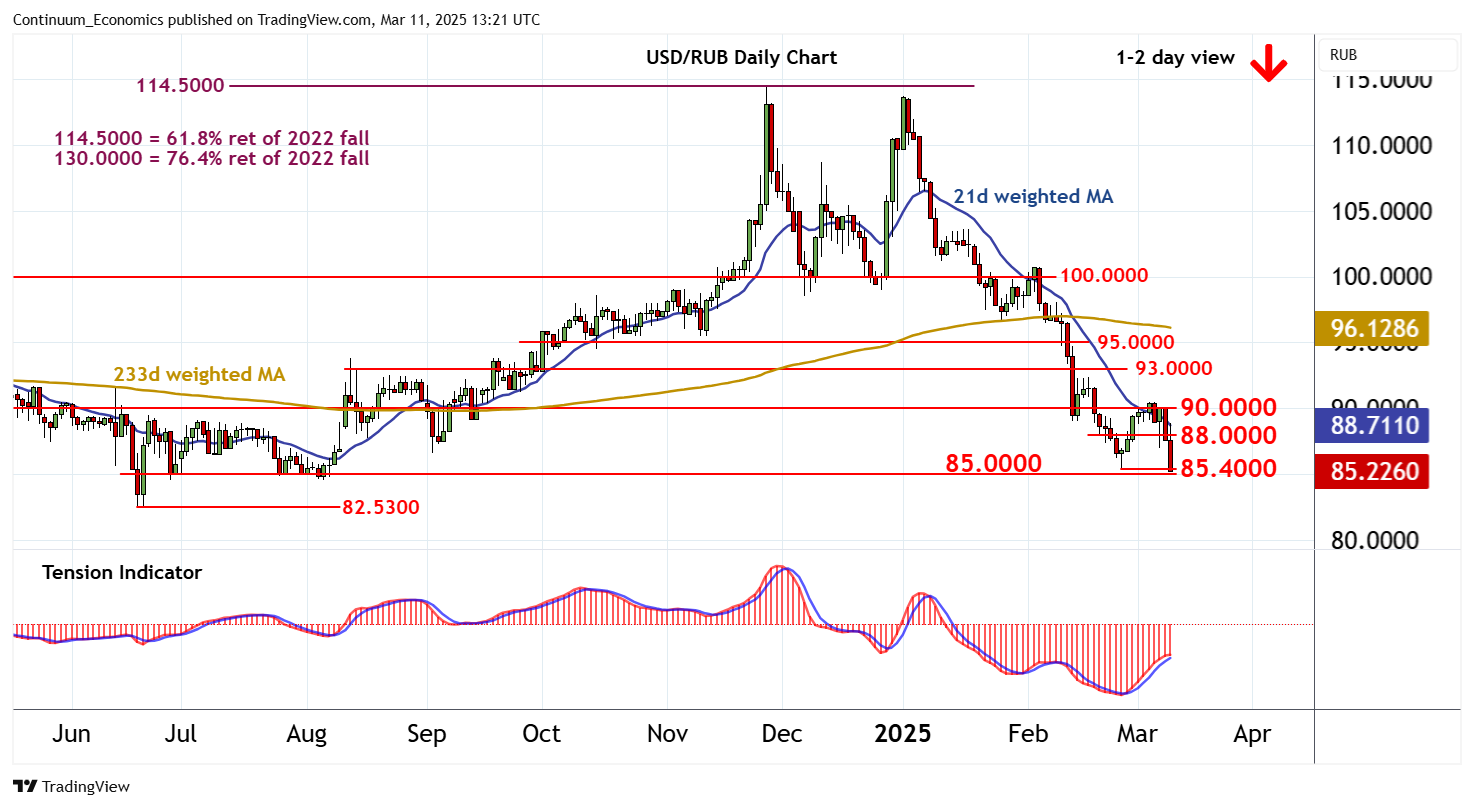
Chart USD/RUB Update: Poised to extend 2024 losses

Senior Technical Strategist
-

Cautious trade has given way to a break lower

| Levels | Comment | Levels | Comment | |||||
| R4 | 95.0000 | * | break level | S1 | 85.4000 | * | 26 Feb YTD low | |
| R3 | 93.0000 | * | break level | S2 | 85.0000 | ** | congestion | |
| R2 | 90.0000 | ** | congestion | S3 | 82.5300 | ** | Jun 2024 (y) low | |
| R1 | 88.0000 | break level | S4 | 80.0000 | ** | congestion |
Asterisk denotes strength of level
13:05 GMT - Cautious trade has given way to a break lower, with prices currently pressuring strong support at the 85.4000 current year low of 26 February. Just lower is congestion around 85.0000. Daily stochastics continue to track lower and the rising daily Tension Indicator is showing early signs of flattening, suggesting room for a later break of this area and extension of November losses towards the 82.5300 year low of June 2024. Negative weekly charts point to room for still deeper losses, with a further close beneath here confirming a deeper correction of the 2022-2024 gains. Meanwhile, a close back above 88.0000 would stabilise price action and prompt consolidation beneath congestion around 90.0000.