Chart USD/ZAR Update: Consolidating - daily studies improving
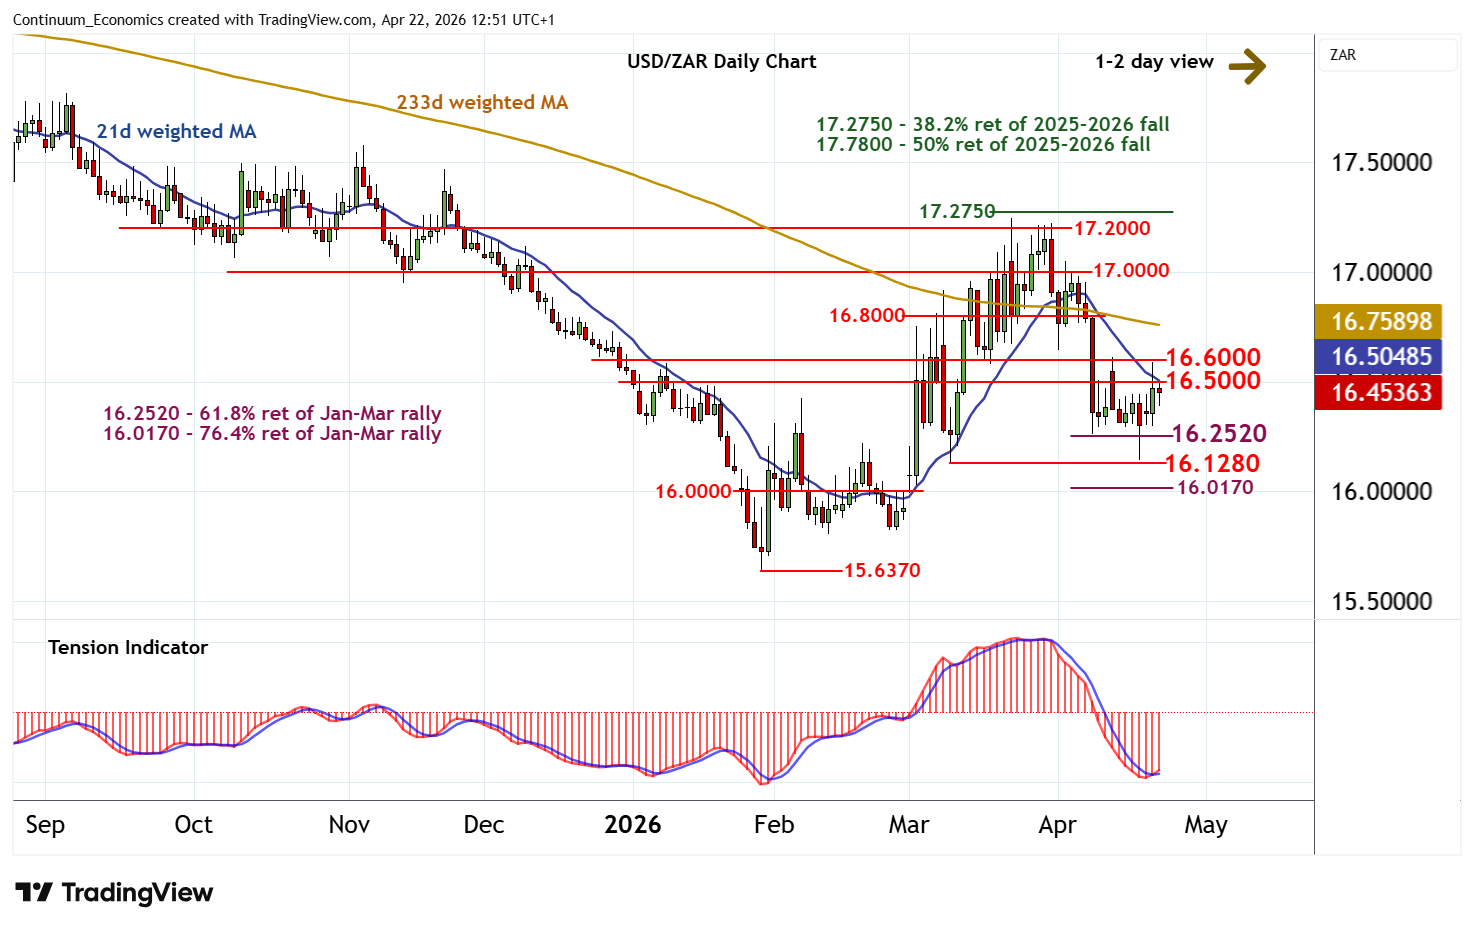
The spike into resistance within the 16.5000 - 16.6000 range is giving way to fresh consolidation around 16.4500
| Level | Comment | Level | Comment | |||||
|---|---|---|---|---|---|---|---|---|
| R4 | 17.0000 | * | congestion | S1 | 16.2520 | ** | 61.8% ret of Jan-Mar rally | |
| R3 | 16.8000 | * | congestion | S2 | 16.1280 | * | 10 Mar (w) low | |
| R2 | 16.6000 | break level | S3 | 16.0170 | ** | 76.4% ret of Jan-Mar rally | ||
| R1 | 16.5000 | break level | S4 | 16.0000 | ** | congestion |
Asterisk denotes strength of level
12:45 BST - The spike into resistance within the 16.5000 - 16.6000 range is giving way to fresh consolidation around 16.4500, as positive intraday studies turn mixed. Oversold daily stochastics continue to unwind and the daily Tension Indicator is also turning higher, highlighting room for a fresh test of this range. A break above here will open up congestion around 16.8000. But negative weekly charts should prompt renewed selling interest towards here and limit any tests in consolidation. Meanwhile, support remains at the 16.2520 Fibonacci retracement. A close beneath here is needed to turn sentiment negative and extend late-March losses back to 16.1280, ahead of the 16.0170 retracement.