Published: 2026-03-09T14:32:23.000Z
Chart AUD/USD Update: Choppy trade - studies under pressure
1
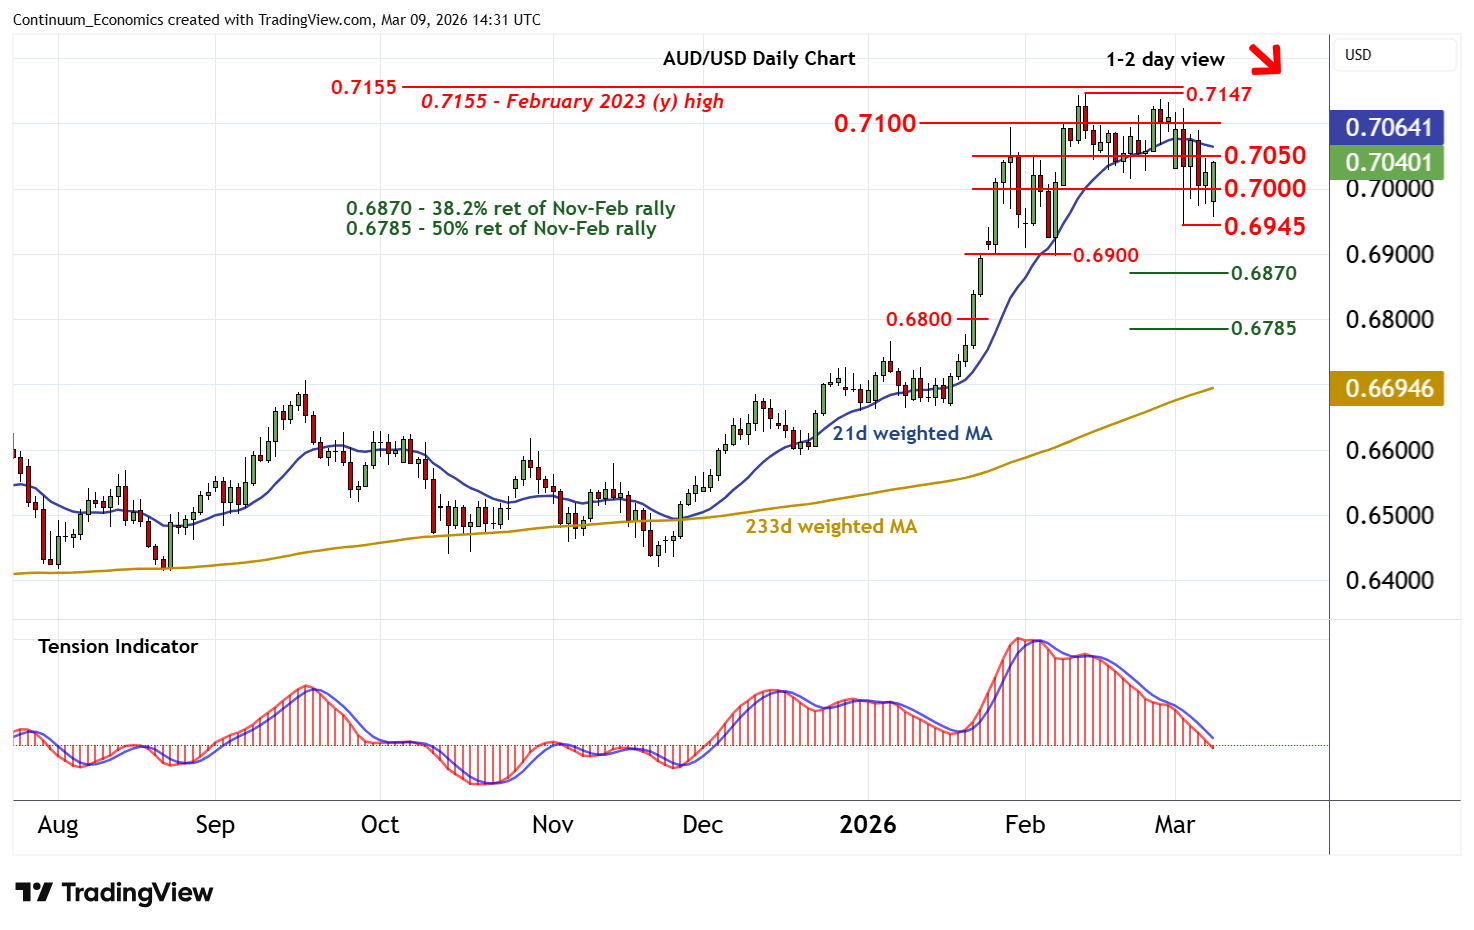
The anticipated break below 0.7000 has bounced smartly from above the 0.6945 weekly low of 3 March
| Levels | Imp | Comment | Levels | Imp | Comment | |||
|---|---|---|---|---|---|---|---|---|
| R4 | 0.7210 | ** | 61.8% ret of 2021-2025 fall | S1 | 0.7000 | * | congestion | |
| R3 | 0.7147/55~ | ** | 12 Feb YTD high; Feb 2023 (y) high | S2 | 0.6945 | * | 3 Mar (w) low | |
| R2 | 0.7100 | break level | S3 | 0.6900 | ** | break level | ||
| R1 | 0.7050 | * | congestion | S4 | 0.6870 | * | 38.2% ret of Nov-Feb rally |
Asterisk denotes strength of level
14:20 GMT - The anticipated break below 0.7000 has bounced smartly from above the 0.6945 weekly low of 3 March, as intraday studies turn higher, with prices once again trading above 0.7000. Immediate focus is on congestion resistance at 0.7050. But negative daily and weekly readings should limit any tests above here in renewed selling interest beneath 0.7100. Following cautious/corrective trade, fresh losses are looked for. However, a close below 0.6945 is needed to turn sentiment negative and extend February losses initially to support at 0.6900.