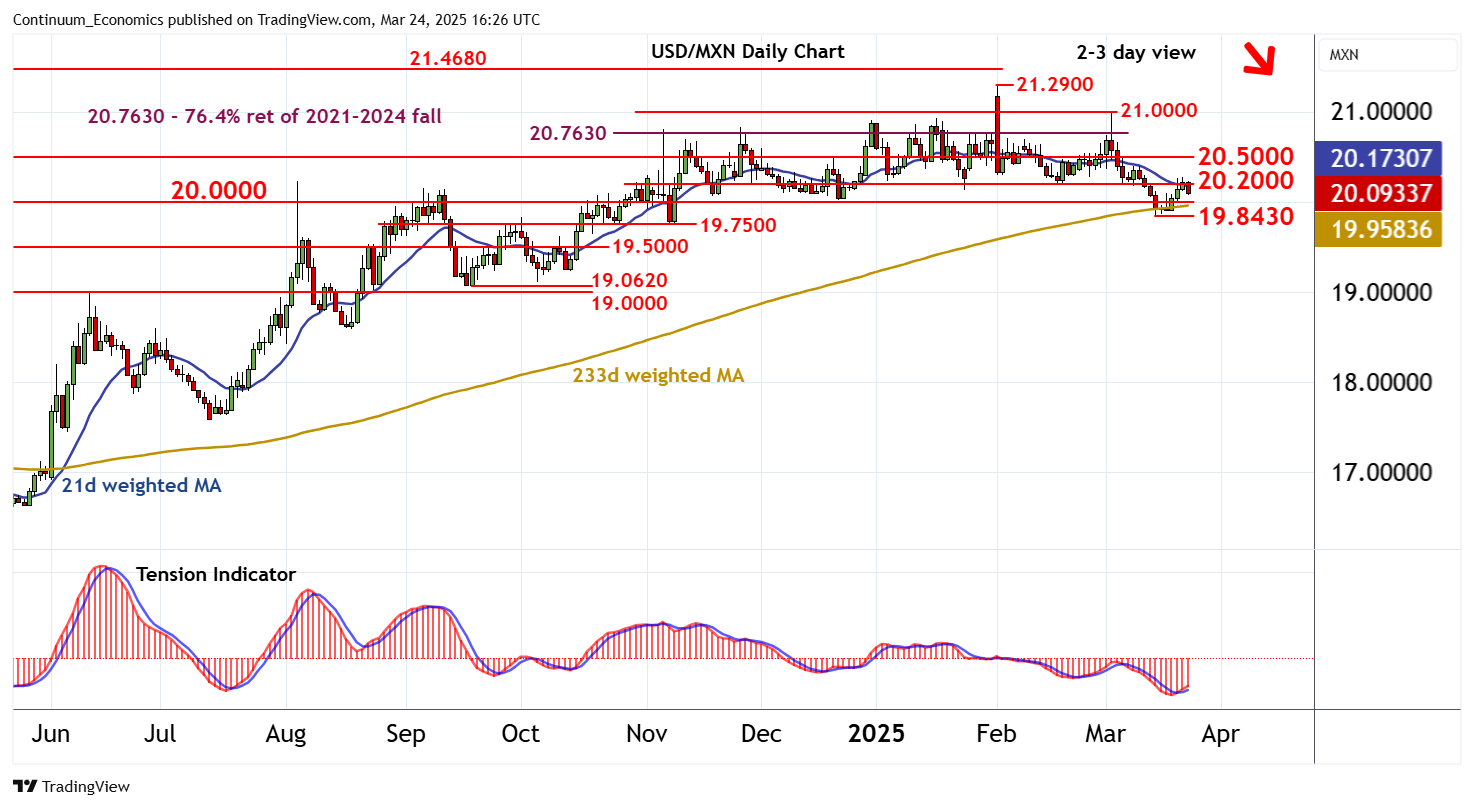
Chart USD/MXN Update: Leaning lower in cautious trade

The bounce from the 19.8430 fresh 2024 year low of 14 March is meeting selling interest around the 20.2000 break level

| Levels | Imp | Comment | Levels | Imp | Comment | |||
|---|---|---|---|---|---|---|---|---|
| R4 | 21.0000 | ** | 4 Mar high | S1 | 20.0000 | * | congestion | |
| R3 | 20.7630 | ** | 76.4% ret of 2021-2024 fall | S2 | 19.8430 | ** | 14 Mar YTD low | |
| R2 | 20.5000 | * | congestion | S3 | 19.7500 | * | break level | |
| R1 | 20.2000 | break level | S4 | 19.5000 | * | congestion |
Asterisk denotes strength of level
16:20 GMT - The bounce from the 19.8430 fresh 2024 year low of 14 March is meeting selling interest around the 20.2000 break level, as intraday studies turn down, with prices currently trading around 20.1000. A test of congestion support at 20.0000 cannot be ruled out. But rising daily readings are expected to limit any initial break in renewed consolidation above 19.8430. Broader weekly charts are mixed/negative, highlighting potential for deeper losses, with a later close beneath here turning sentiment outright negative and extending February losses initially to 19.7500. Meanwhile, a close above 20.2000, if seen, will help to stabilise price action and prompt consolidation beneath congestion around 20.5000.