Published: 2025-11-21T08:08:16.000Z
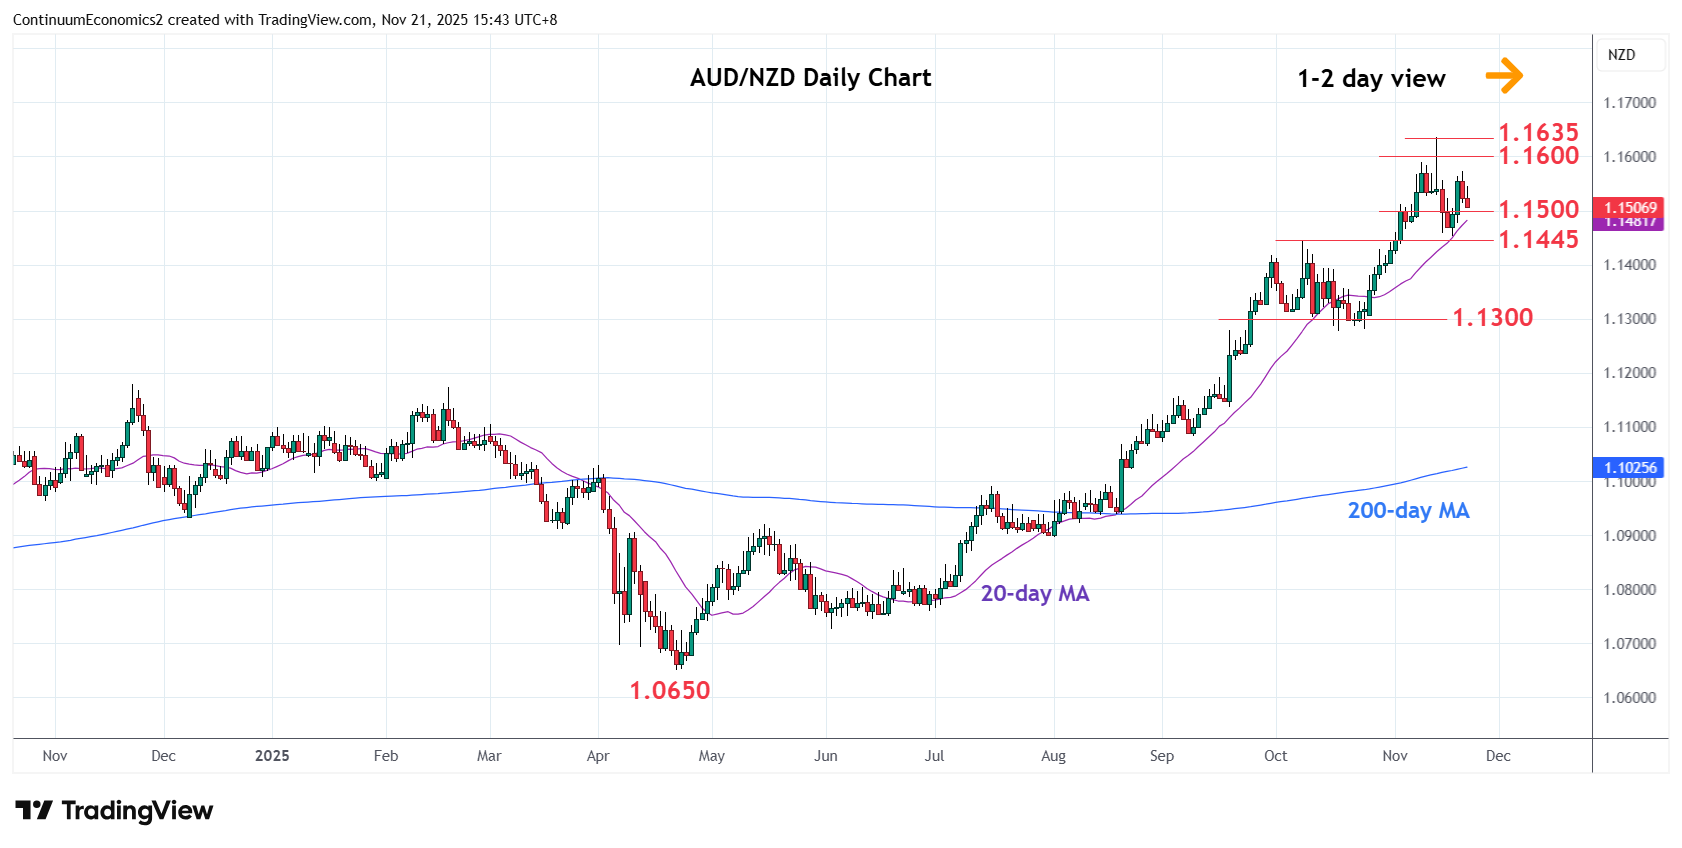
Chart AUD/NZD Update: Leaning lower from 1.1600/35 resistance
-
Turning lower in consolidation beneath resistance at the 1.1600/35 congestion
| Level | Comment | Level | Comment | |||||
|---|---|---|---|---|---|---|---|---|
| R4 | 1.1750 | * | congestion from Jul 2013 | S1 | 1.1500 | * | congestion | |
| R3 | 1.1660 | * | Sep 2013 high | S2 | 1.1445 | ** | Oct high | |
| R2 | 1.1600/35 | ** | congestion, 13 Nov YTD high | S3 | 1.1400 | * | congestion | |
| R1 | 1.1572 | 20 Nov high | S4 | 1.1350 | * | congestion |
Asterisk denotes strength of level
08:00 GMT - Turning lower in consolidation beneath resistance at the 1.1600/35 congestion as bullish momentum fades and threatens a top pattern at the 1.1635 high. Daily studies have turned mixed while bearish divergence on weekly chart threatens pullback to retrace strong gains from the April YTD low. Would take break of support at 1.1500 level and 1.1445 October high to confirm a top in place at the 1.1635 high. Meanwhile, resistance is lowered to 1.1572 which should cap and sustain pullback from the 1.1600/35 resistance.