Published: 2025-11-04T14:22:10.000Z
Chart EUR/JPY Update: Lower in both EUR- and JPY-driven trade
1
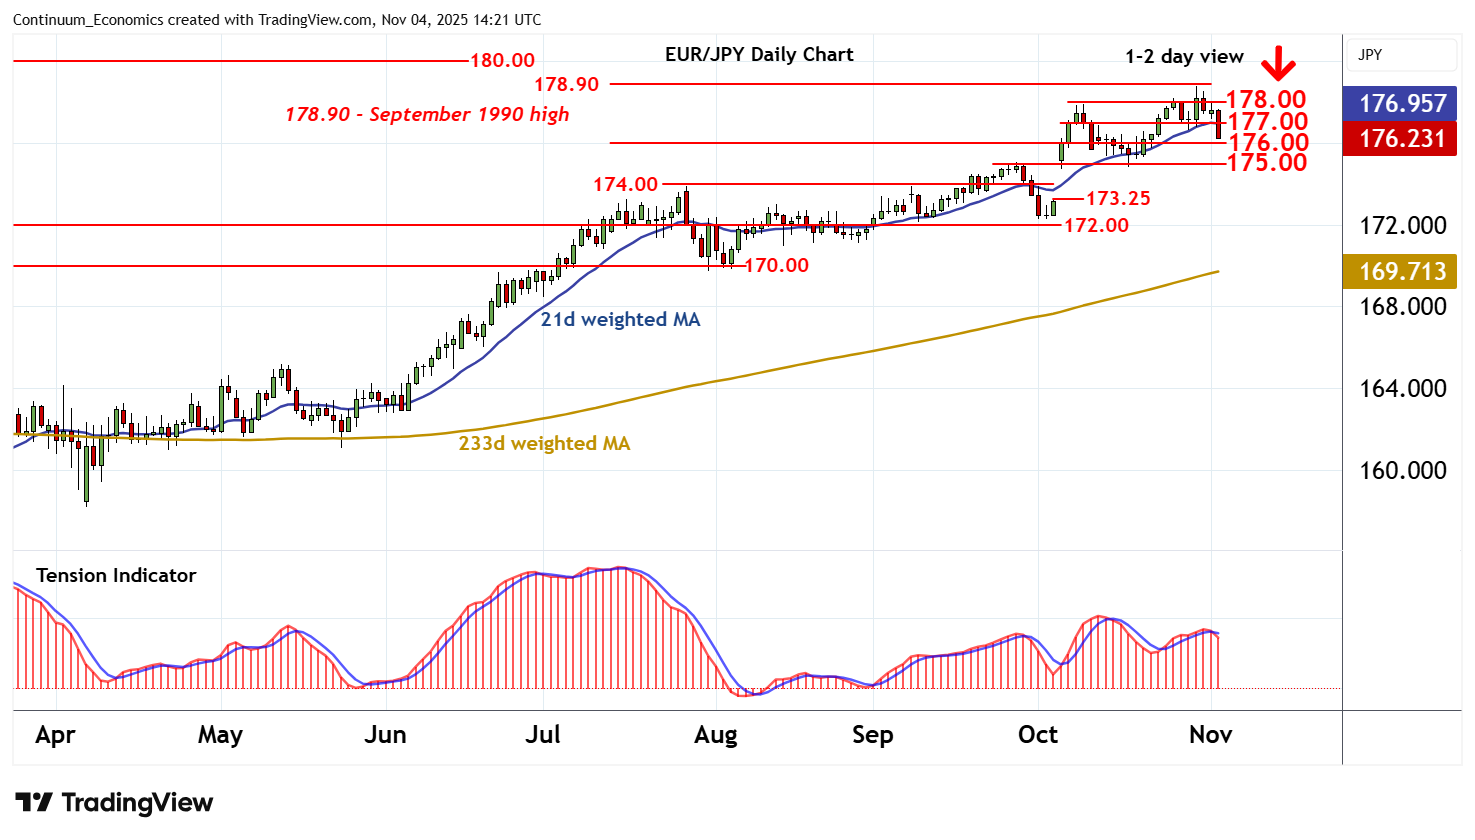
Anticipated losses are extending in both EUR- and JPY-driven trade
| Levels | Imp | Comment | Levels | Imp | Comment | |||
|---|---|---|---|---|---|---|---|---|
| R4 | 180.00 | ** | historic congestion | S1 | 176.00 | * | break level | |
| R3 | 178.90 | ** | Sep 1990 high | S2 | 175.00 | * | congestion | |
| R2 | 178.00 | break level | S3 | 174.00 | ** | congestion | ||
| R1 | 177.00 | break level | S4 | 173.25 | ** | 3 Oct high, gap low |
Asterisk denotes strength of level
14:10 GMT - Anticipated losses are extending in both EUR- and JPY-driven trade, with focus turning to support at 176.00. Daily studies have turned bearish and broader weekly charts have turned mixed/negative, suggesting room for deeper losses in the coming sessions. A break below 176.00 will open up congestion around 175.00. But by-then oversold daily stochastics could limit any initial tests in consolidation. Meanwhile resistance is lowered to 177.00. A close above here would help to stabilise price action and prompt consolidation beneath 178.00.