Published: 2025-10-02T01:44:09.000Z
Chart GBP/USD Update: Extend corrective bounce
5
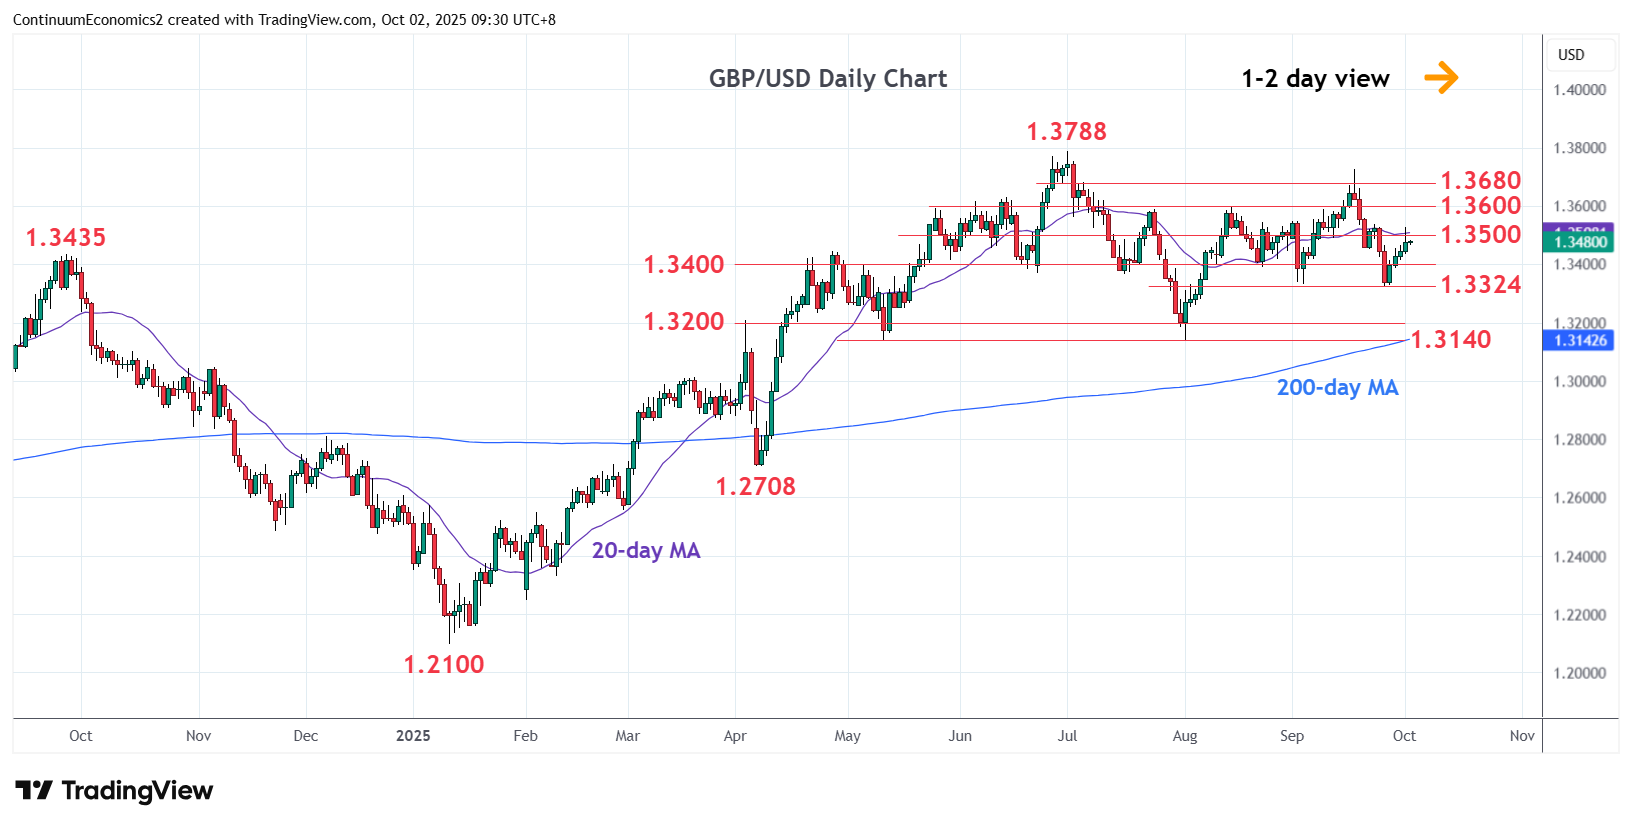
Extend bounce from the 1.3324 low of last week as prices consolidate losses from the 1.3726 September high to reach the 1.3500/36 resistance
| Level | Comment | Level | Comment | |||||
|---|---|---|---|---|---|---|---|---|
| R4 | 1.3680/00 | * | 4 Jul high, congestion | S1 | 1.3400 | * | congestion | |
| R3 | 1.3600 | ** | Aug high, congestion | S2 | 1.3324 | ** | 25 Sep low | |
| R2 | 1.3536 | * | 23 Sep high | S3 | 1.3300 | * | congestion | |
| R1 | 1.3500 | * | congestion | S4 | 1.3200 | * | congestion |
Asterisk denotes strength of level
01:40 GMT - Extend bounce from the 1.3324 low of last week as prices consolidate losses from the 1.3726 September high to reach the 1.3500/36 resistance. This is expected to cap corrective bounce and give way to renewed selling pressure later to retrace the August/September rally. Meanwhile, support is raised to 1.3400 level ahead of the 1.3324 low. Break of these will see room for extension to support at the 1.3300 and 1.3200 congestion. Below these will return focus to the critical 1.3140 August low and 38.2% Fibonacci level.