Chart USD/ZAR Update: Consolidating - daily studies under pressure

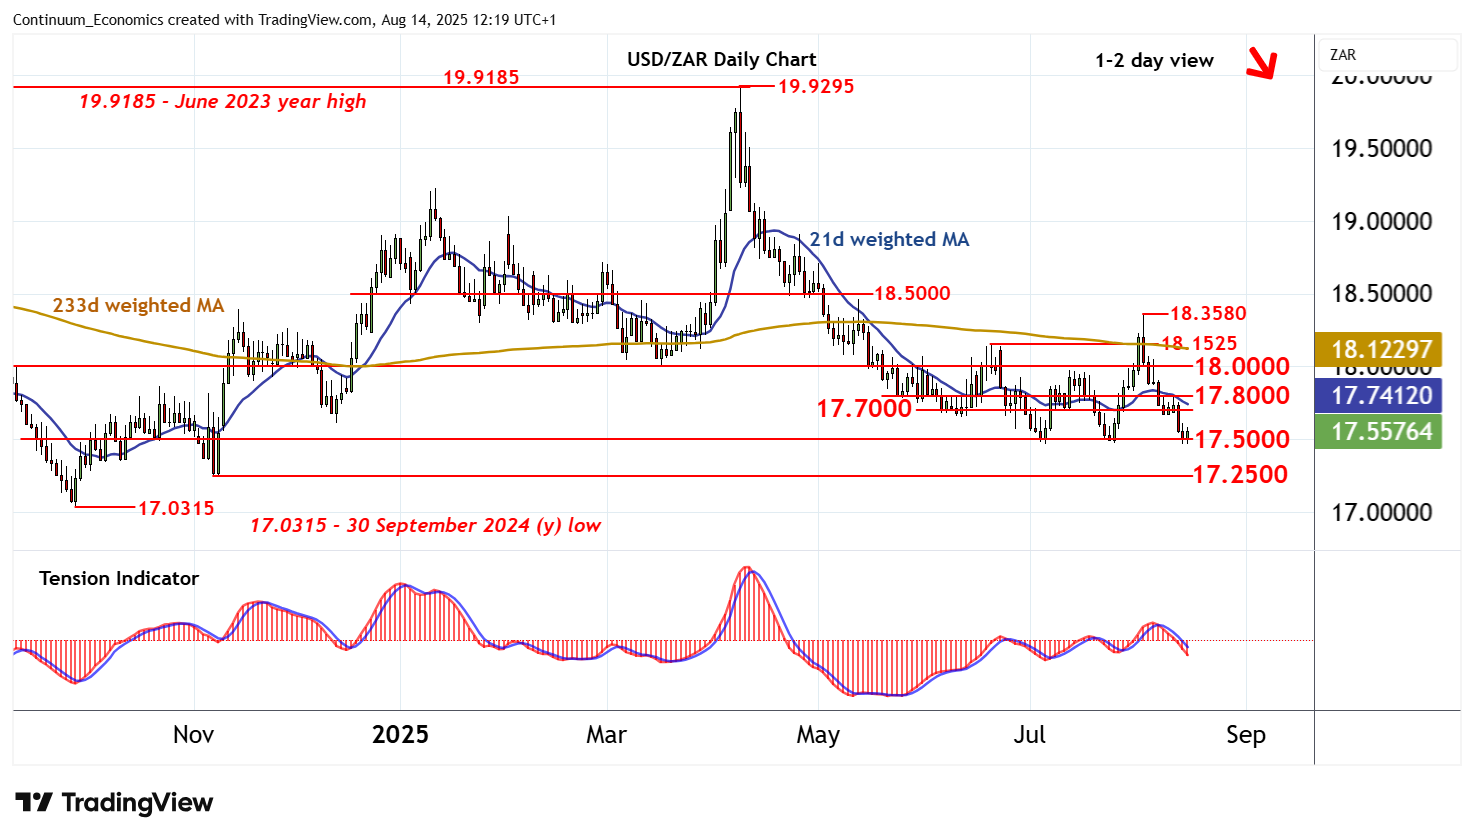
The test of strong support at congestion around 17.5000 and the 17.4690 current year low of 4 July has given way to a minor bounce
| Level | Comment | Level | Comment | |||||
|---|---|---|---|---|---|---|---|---|
| R4 | 18.1525 | ** | 19 Jun (m) high | S1 | 17.5000 | ** | congestion | |
| R3 | 18.0000 | ** | congestion | S2 | 17.4690 | ** | 4 Jul YTD low | |
| R2 | 17.8000 | * | congestion | S3 | 17.2500 | ** | 7 Nov (m) low | |
| R1 | 17.7000 | * | congestion | S4 | 17.0315 | ** | 30 Sep 2024 (y) low |
Asterisk denotes strength of level
12:10 BST - The test of strong support at congestion around 17.5000 and the 17.4690 current year low of 4 July has given way to a minor bounce, as oversold intraday studies unwind, with prices currently trading around 17.5550. Daily stochastics and the daily Tension Indicator continue to track lower, however, highlighting room for a later break beneath here and extension of April losses towards the 17.2500 monthly low of 7 November. But mixed weekly charts could limit any initial tests in consolidation. Meanwhile, resistance is at congestion around 17.7000 and extends to further congestion around 17.8000. This range should cap any immediate tests higher.