Chart USD/MXN Update: Consolidation giving way to a bounce

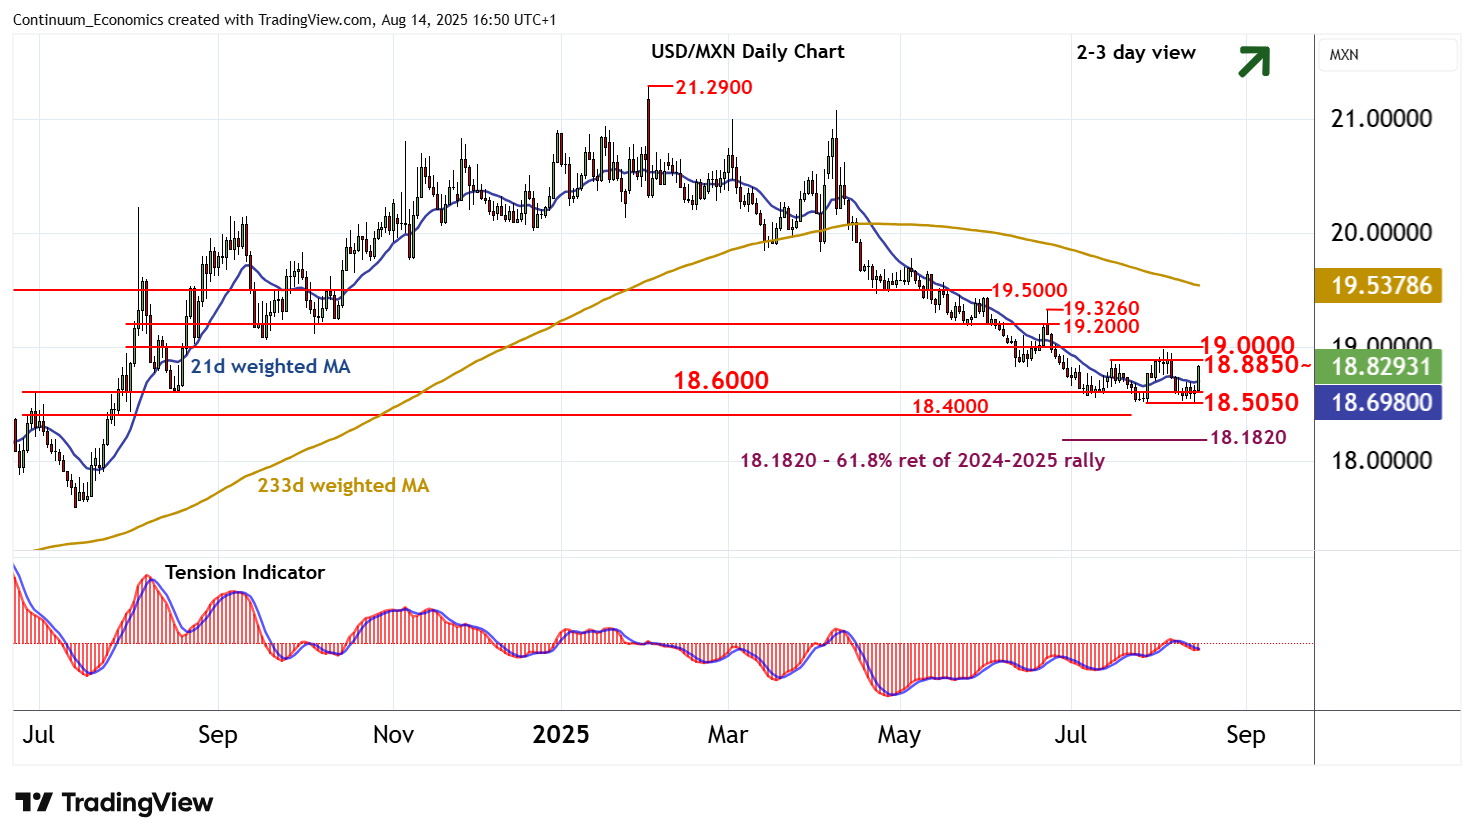
Consolidation within strong support at the 18.5050 current year low of 28 July and 18.6000 has given way to a steady bounce
| Levels | Imp | Comment | Levels | Imp | Comment | |||
|---|---|---|---|---|---|---|---|---|
| R4 | 19.3260 | ** | 23 Jun (w) high | S1 | 18.6000 | ** | July-August 2024 break level | |
| R3 | 19.2000 | * | congestion | S2 | 18.5050 | ** | 28 Jul YTD low | |
| R2 | 19.0000 | * | congestion | S3 | 18.4265 | 1 Aug 2024 (m) low | ||
| R1 | 18.8850 | * | 15 Jul (m) high | S4 | 18.4000 | ** | congestion |
Asterisk denotes strength of level
16:35 BST - Consolidation within strong support at the 18.5050 current year low of 28 July and 18.6000 has given way to a steady bounce, as daily stochastics turn higher and the negative daily Tension Indicator flattens, with prices currently trading around 18.8200. Focus is on resistance at the 18.8850 monthly high of 15 July. But already overbought intraday studies are expected to limit any initial tests in consolidation, before positive weekly charts prompt a break and extend July gains beyond congestion around 19.0000 towards further congestion around 19.2000. Meanwhile, an unexpected close below 18.5050 will turn sentiment negative and extend February losses initially towards the 18.4265 monthly low of 1 August 2024.