Chart USD/ZAR Update: Consolidating - studies under pressure
Little change, as prices extend pressure on the 15.8800 Fibonacci retracement
| Level | Comment | Level | Comment | |||||
|---|---|---|---|---|---|---|---|---|
| R4 | 16.7000 | break level | S1 | 15.8800 | ** | 61.8% ret of 2021-2023 rally | ||
| R3 | 16.5000 | break level | S2 | 15.6370 | ** | 29 Jan YTD low | ||
| R2 | 16.1060 | ** | 11 Aug 2022 (m) low | S3 | 15.1665 | * | June 2022 low | |
| R1 | 16.0000 | ** | congestion | S4 | 15.0000 | ** | congestion |
Asterisk denotes strength of level
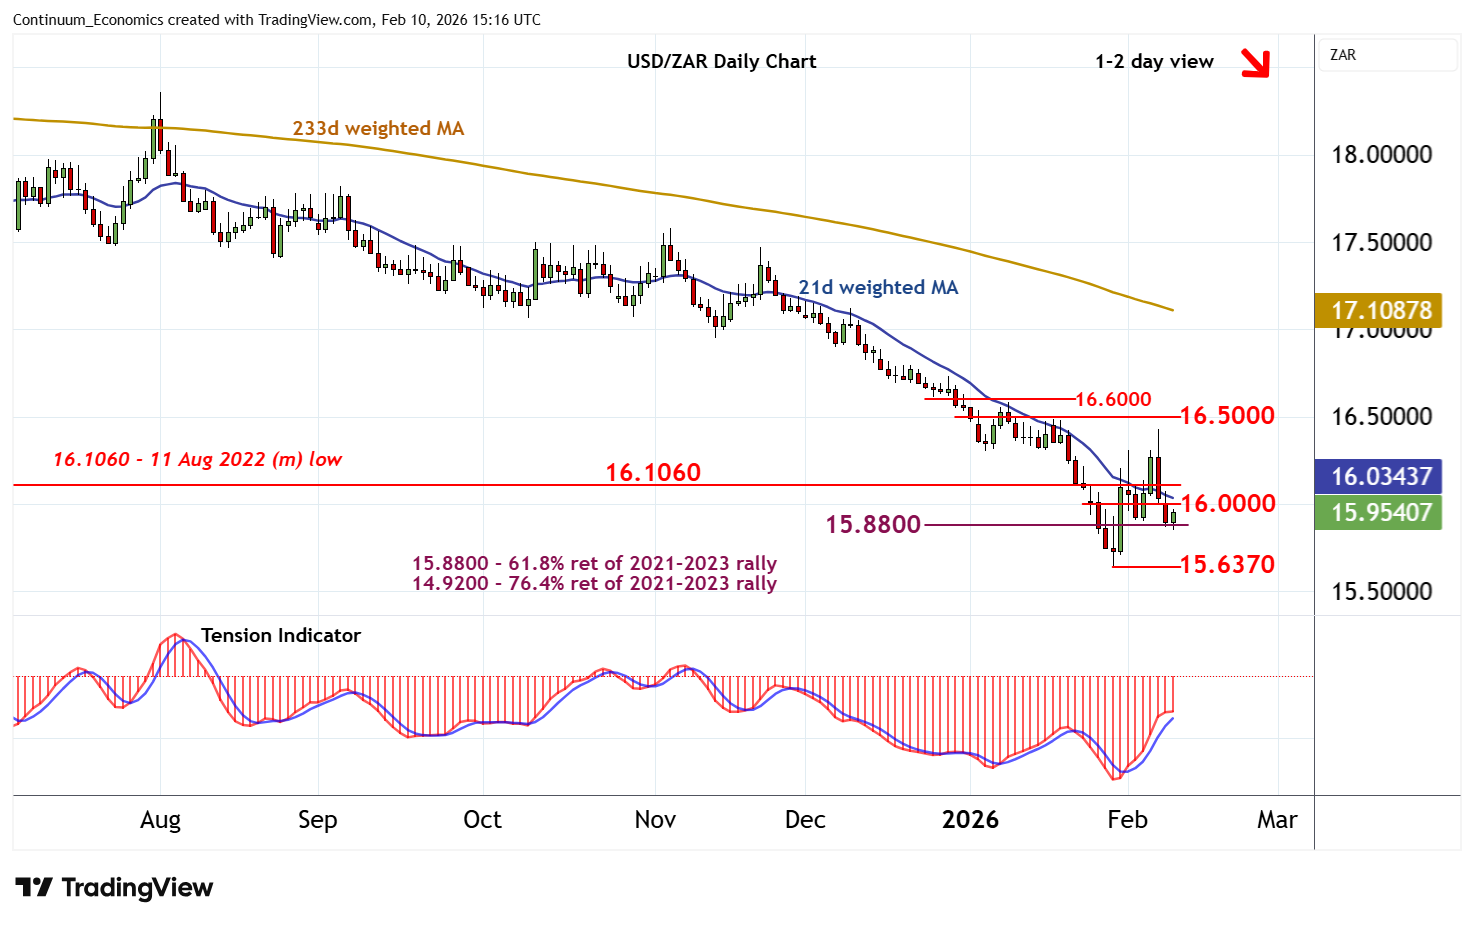
15:00 GMT - Little change, as prices extend pressure on the 15.8800 Fibonacci retracement. The rising daily Tension Indicator is flattening and broader weekly charts are bearish, highlighting a cautious tone and room for renewed losses in the coming sessions. A break below 15.8800 will open up critical support at the 15.6370 current year low of 29 January. A further close beneath here will add weight to sentiment and extend June 2023 losses initially towards the 15.1665 low of June 2022. Meanwhile, resistance is at congestion around 16.0000 and extends to 16.1060. A close above here is needed to help to stabilise price action and prompt consolidation beneath 16.5000.