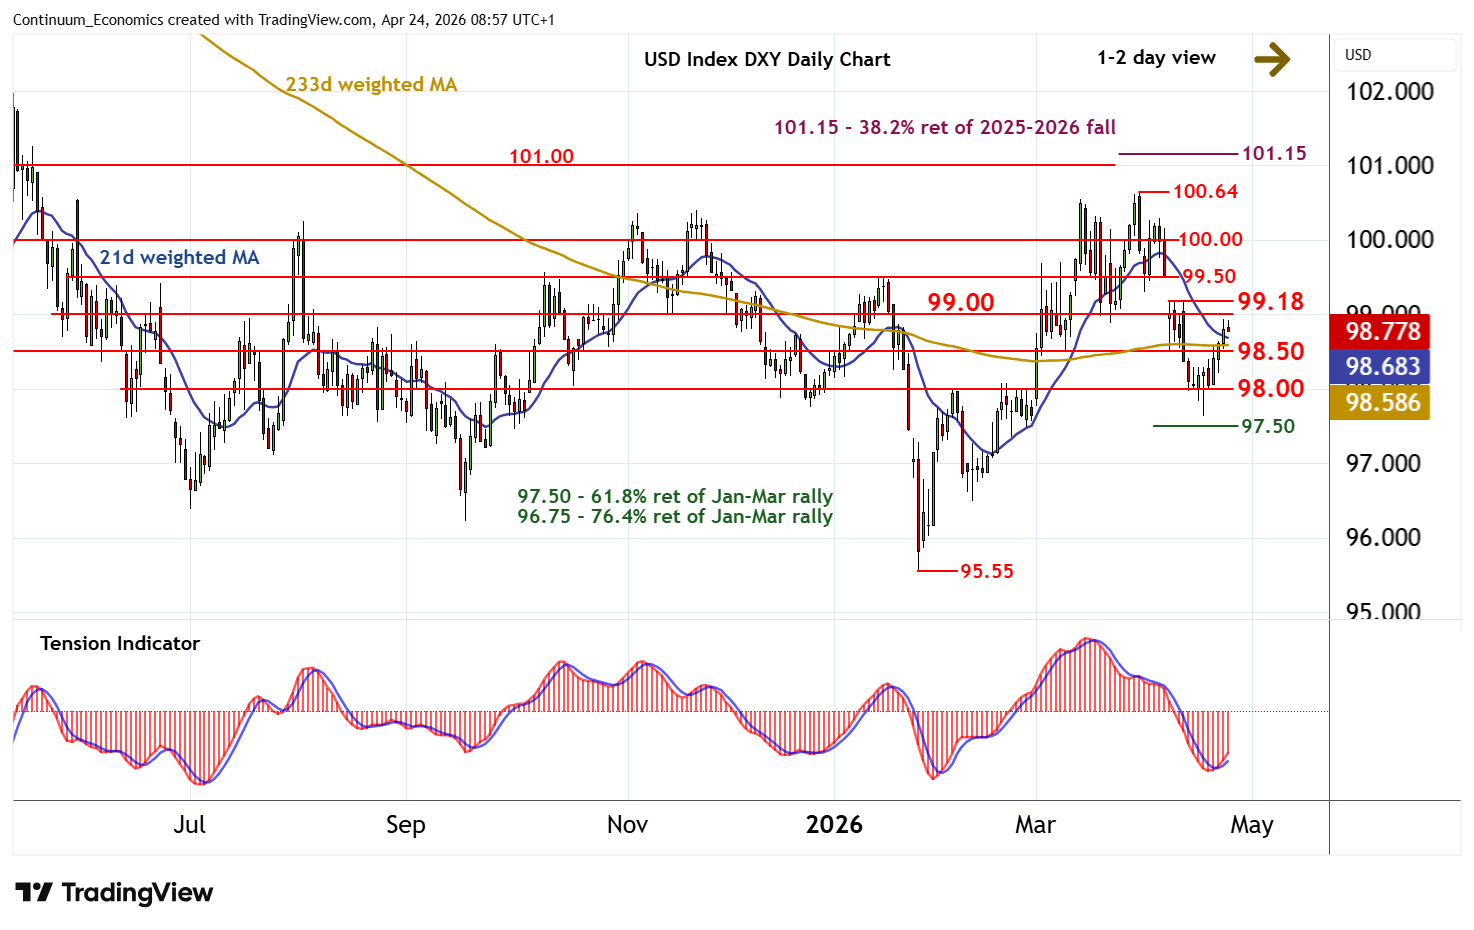
Chart USD Index DXY Update: Strong resistance at 99.00/18
Anticipated gains have reached 98.95~, where deteriorating intraday studies are prompting renewed selling interest
| Levels | Imp | Comment | Levels | Imp | Comment | |||
|---|---|---|---|---|---|---|---|---|
| R4 | 100.30 | * | congestion | S1 | 98.50 | * | congestion | |
| R3 | 100.00 | ** | congestion | S2 | 98.00 | ** | congestion | |
| R2 | 99.50 | * | congestion | S3 | 97.63 | 17 Apr (w) low | ||
| R1 | 99.00/18 | ** | congestion; 8 Apr high | S4 | 97.50 | ** | congestion; 61.8% ret |
Asterisk denotes strength of level
08:50 BST - Anticipated gains have reached 98.95~, where deteriorating intraday studies are prompting renewed selling interest. Daily stochastics and the daily Tension Indicator continue to rise, however, highlighting potential for continuation towards strong resistance at congestion around 99.00 and the 99.18 high of 18 April. But negative weekly charts should limit any immediate tests of this range in renewed selling interest/consolidation. Meanwhile, support remains at congestion around 98.50. A close beneath here will turn sentiment neutral and prompt fresh consolidation above further congestion support at 98.00.