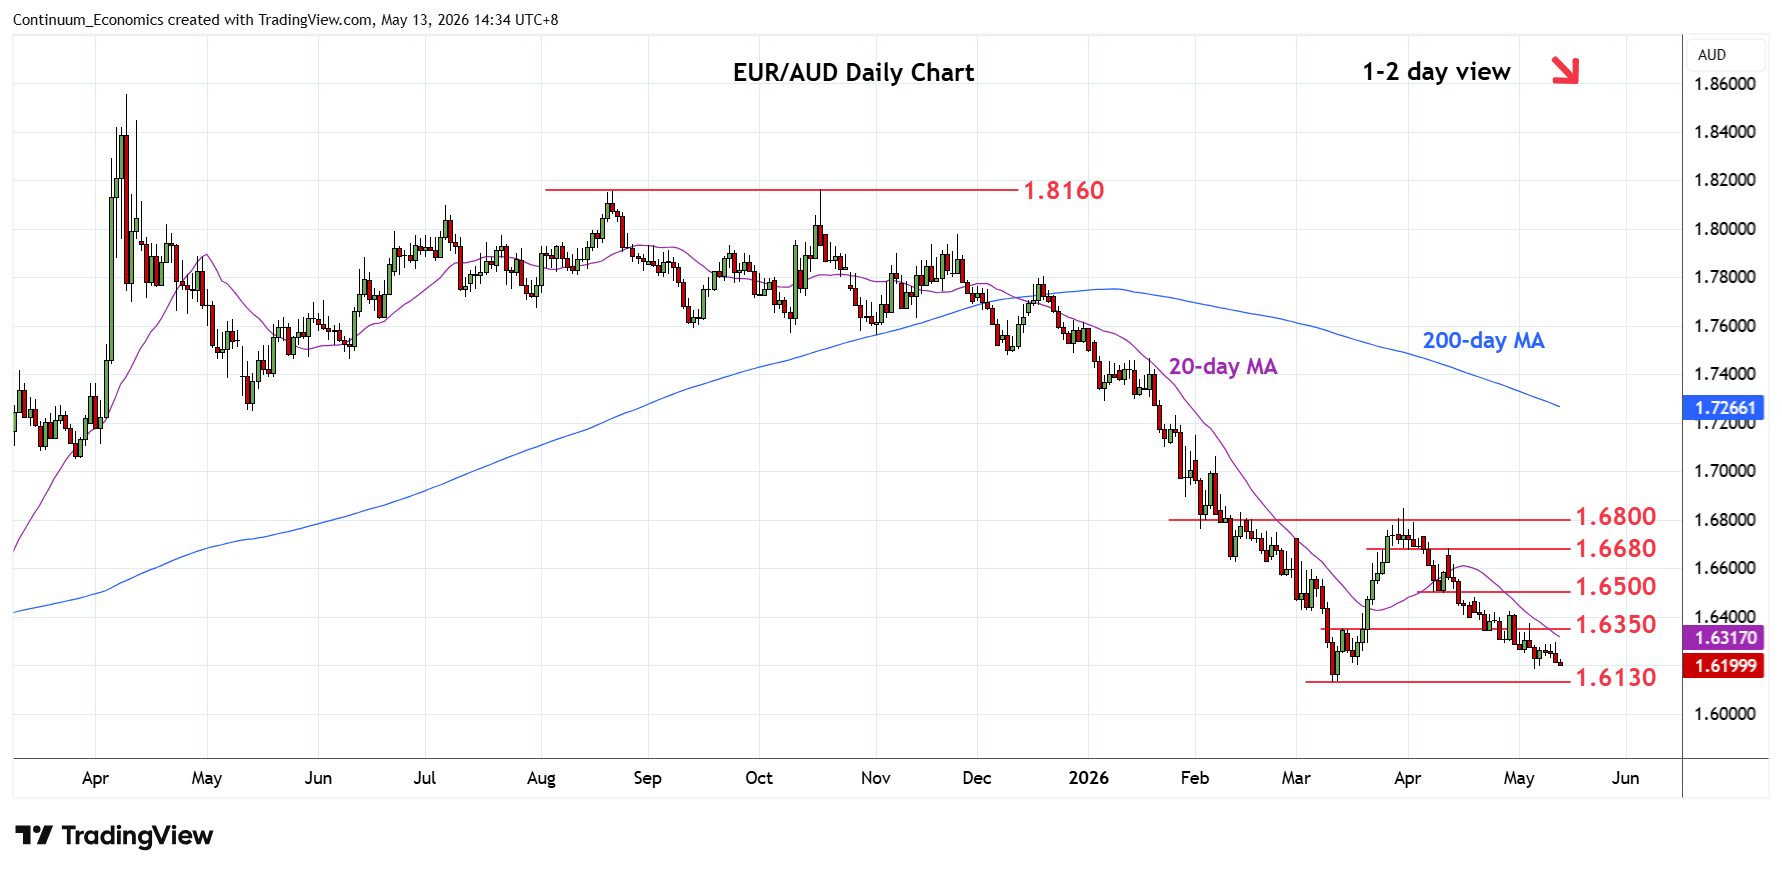
Chart EUR/AUD Update: Still heavy
Consolidating test of the 1.6200 level but pressure remains on the downside and see risk for break to expose the 1.6130 March current year low to retest
| Levels | Imp | Comment | Levels | Imp | Comment | |||
|---|---|---|---|---|---|---|---|---|
| R4 | 1.6600/20 | * | congestion | S1 | 1.6200 | * | 18 Mar low | |
| R3 | 1.6500 | ** | congestion, 8 Apr low | S2 | 1.6130 | ** | 11 Mar YTD low | |
| R2 | 1.6400/25 | * | congestion, 5 Mar low | S3 | 1.6000 | ** | figure, congestion | |
| R1 | 1.6350 | * | congestion, 13 Mar high | S4 | 1.5960 | ** | 2024 year low |
Asterisk denotes strength of level
06:40 GMT - Consolidating test of the 1.6200 level but pressure remains on the downside and see risk for break to expose the 1.6130 March current year low to retest. Bearish structure see risk for break here to extend the broader losses from the April 2025 year high and see extension to 1.6000 figure and 1.5960, 2024 year low. Lower still, will see room to 1.5915, 61.8% Fibonacci retracement. Meanwhile, resistance at the 1.6350/1.6400 congestion area is expected to cap. Regaining this will ease the downside pressure and see room for stronger bounce to 1.6500 resistance.