Published: 2026-03-02T16:37:59.000Z
Chart USD/CAD Update: Higher in both USD- and CAD-driven trade
2
Choppy trade has given way to steady USD- and CAD-driven gain
| Levels | Imp | Comment | Levels | Imp | Comment | |||
|---|---|---|---|---|---|---|---|---|
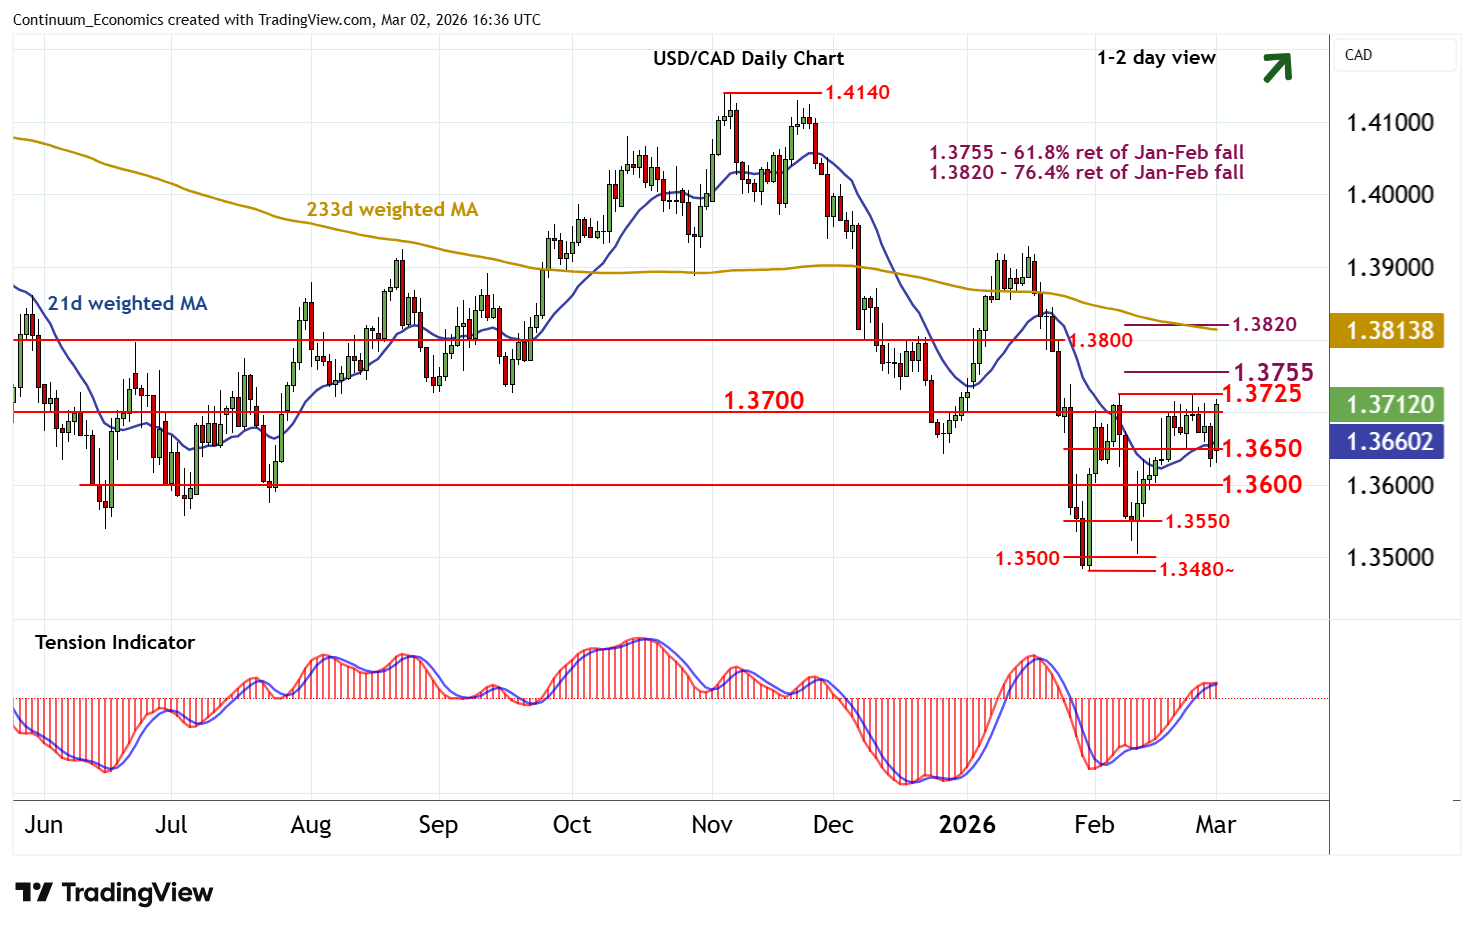
| R4 | 1.3800 | ** | congestion | S1 | 1.3650 | minor congestion | ||
| R3 | 1.3755 | ** | 61.8% ret of Jan-Feb fall | S2 | 1.3600 | * | congestion | |
| R2 | 1.3725 | * | 6 Feb (m) high | S3 | 1.3550 | congestion | ||
| R1 | 1.3700 | * | congestion | S4 | 1.3500 | ** | congestion |
Asterisk denotes strength of level
16:20 GMT - Choppy trade has given way to steady USD- and CAD-driven gains, with prices currently pressuring resistance within congestion around 1.3700 and the 1.3725 monthly high of 6 February. Daily readings have turned mixed/positive and oversold weekly stochastics are unwinding, highlighting room for a break above here. Late-January gains will then focus on strong resistance at the 1.3755 Fibonacci retracement. But the flat weekly Tension Indicator should limit any further break in profit-taking/consolidation beneath 1.3800/25. Meanwhile, support is at congestion around 1.3650 and should underpin any immediate setbacks.