Published: 2025-09-29T01:22:24.000Z
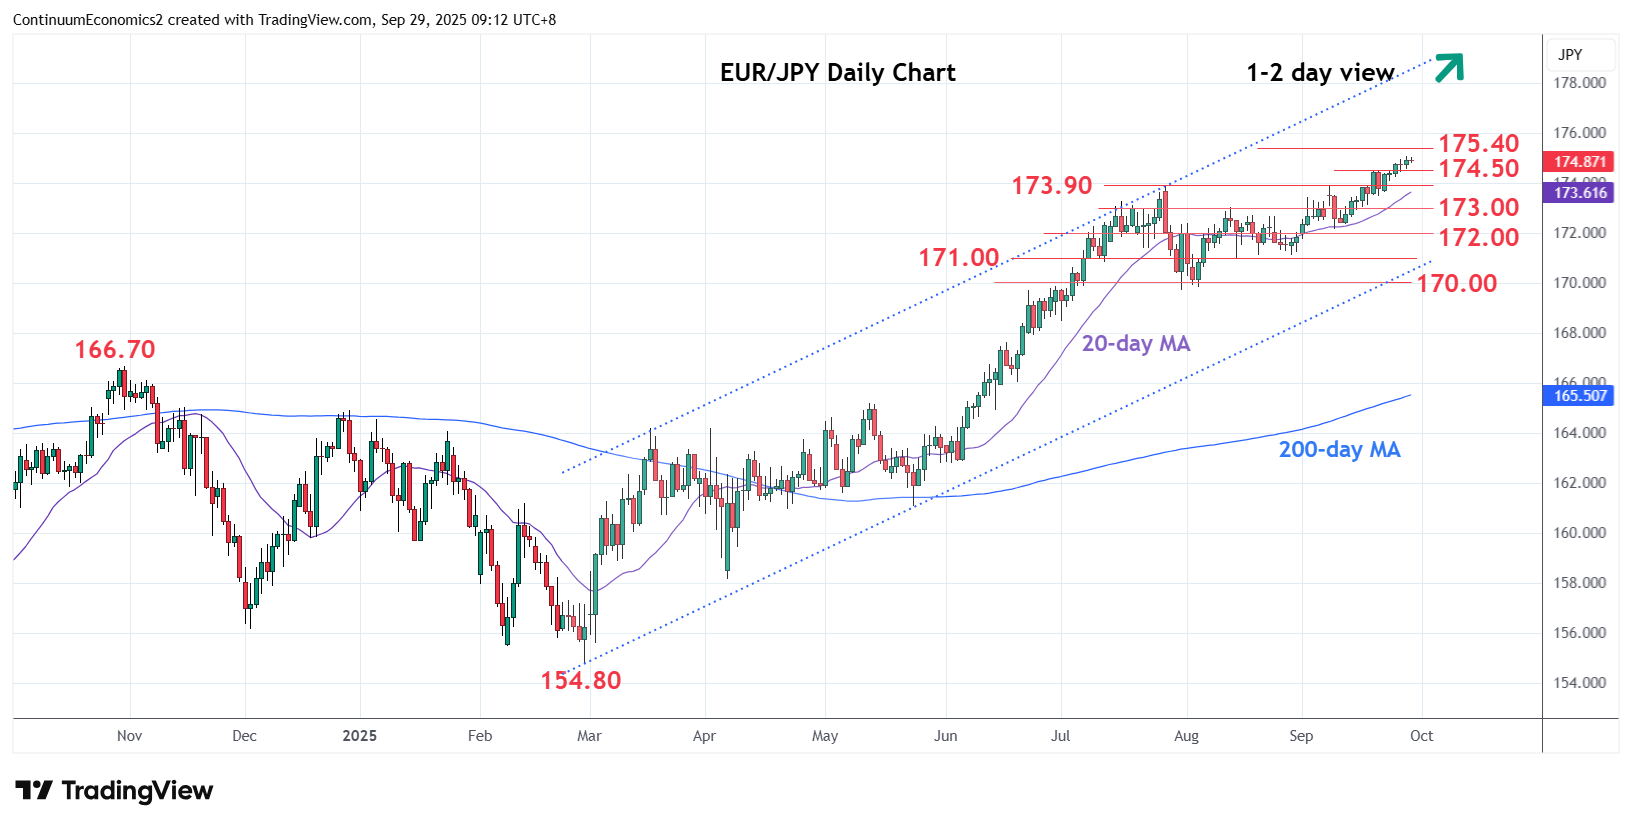
Chart EUR/JPY Update: Within reach of 175.40, multi-year high
1
Break above the 174.50 resistance last week and seen gains to tag 175.00 level
| Levels | Imp | Comment | Levels | Imp | Comment | |||
|---|---|---|---|---|---|---|---|---|
| R4 | 178.00 | * | figure | S1 | 173.90 | ** | Jul high | |
| R3 | 176.00 | * | figure | S2 | 173.00 | * | Aug high, congestion | |
| R2 | 175.40 | ** | July 2024 multi-year high | S3 | 172.14 | ** | 9 Sep low | |
| R1 | 175.00 | * | figure | S4 | 171.00 | * | 14 Aug low, congestion |
Asterisk denotes strength of level
01:15 GMT - Break above the 174.50 resistance last week and seen gains to tag 175.00 level. While, bullish momentum show signs of fading as the daily studies push deep into overbought areas extension to the 175.40, 2024 multi-year high, cannot be ruled out. Would expect reaction at the latter to correct gains from the 170.00 support. Meanwhile, support is raised to the 19 September high at 174.50 and this extend to the 173.90, July high. This area should underpin and break here will fade the upside pressure and open up room for deeper pullback to support at 173.00 and 172.14/00 support.