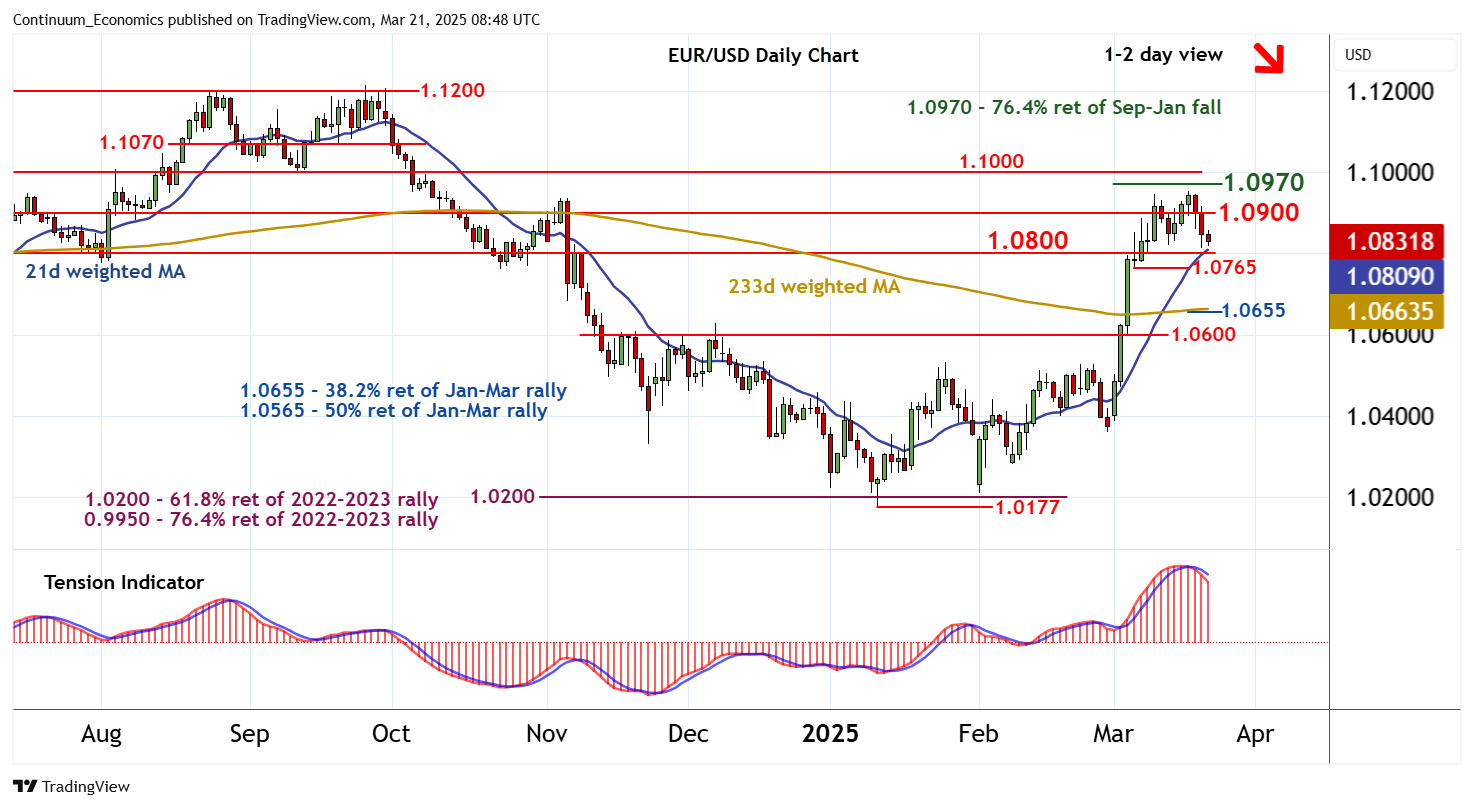
Chart EUR/USD Update: Potential for a test below 1.0800

The pullback from beneath strong resistance at the 1.0970 Fibonacci retracement is giving way to consolidation above support at 1.0800

| Levels | Imp | Comment | Levels | Imp | Comment | |||
|---|---|---|---|---|---|---|---|---|
| R4 | 1.1000 | ** | break level | S1 | 1.0800 | * | break level | |
| 14 | 1.0970 | ** | 76.4% ret of Sep-Jan fall | S2 | 1.0765 | * | 6 Mar low | |
| R2 | 1.0954 | 18 Mar YTD high | S3 | 1.0655 | ** | 38.2% ret of Jan-Mar rally | ||
| R1 | 1.0900 | * | break level | S4 | 1.0600 | ** | congestion |
Asterisk denotes strength of level
08:30 GMT - The pullback from beneath strong resistance at the 1.0970 Fibonacci retracement is giving way to consolidation above support at 1.0800. However, intraday studies have turned down and daily readings are also under pressure, highlighting room for a deeper correction. A close below here will open up the 1.0765 low of 6 March, where rising weekly charts are expected to prompt renewed buying interest/consolidation. But a close beneath here would turn sentiment negative and prompt a deeper correction, opening up supports at the 1.0655 Fibonacci retracement and congestion around 1.0600. Meanwhile, resistance remains at 1.0900. A close above here, if seen, would turn sentiment neutral and give way to fresh consolidation beneath 1.0970.