Chart GBP/USD Update: Back in range, but studies improving

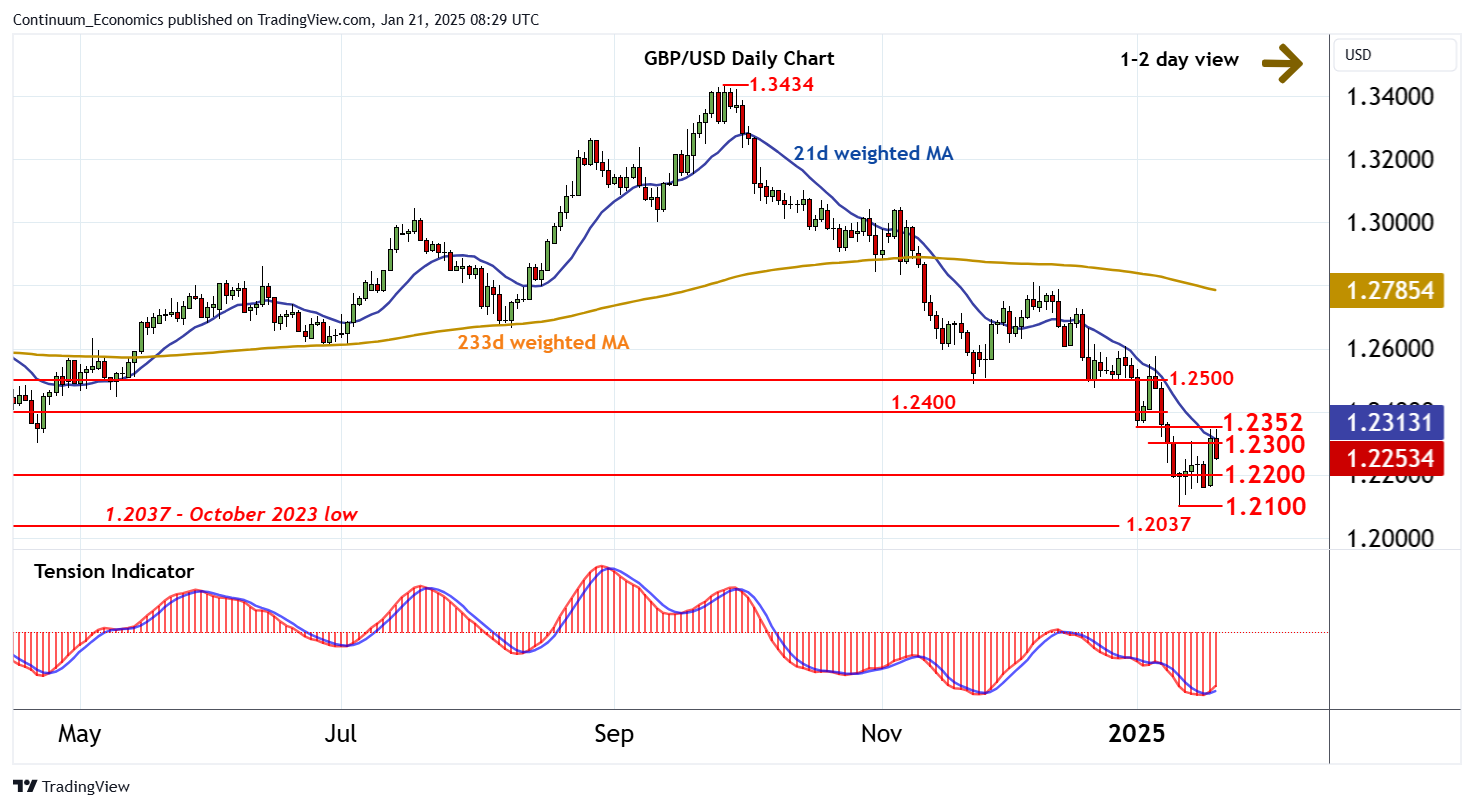
The test of resistance at the 1.2352 weekly low of 2 January has given way to the anticipated pullback

| Level | Comment | Level | Comment | |||||
|---|---|---|---|---|---|---|---|---|
| R4 | 1.2500 | ** | break level | S1 | 1.2200 | * | congestion | |
| R3 | 1.2400 | minor congestion | S2 | 1.2160 | 17 Jan low | |||
| R2 | 1.2352 | * | 2 Jan (w) low | S3 | 1.2100 | ** | 13 Jan YTD low | |
| R1 | 1.2300 | * | break level | S4 | 1.2037 | ** | October 2023 (m) low |
Asterisk denotes strength of level
08:10 GMT - The test of resistance at the 1.2352 weekly low of 2 January has given way to the anticipated pullback, as overbought intraday studies unwind, with prices currently balanced in consolidation back below 1.2300. Focus is turning to congestion support at 1.2200, but rising daily readings and a tick higher in oversold weekly stochastics are expected to limit any tests in renewed buying interest/consolidation. Following cautious trade, fresh gains are looked for. However, a close above 1.2352 is needed to turn sentiment positive and extend January gains beyond 1.2400 towards 1.2500. Meanwhile, a close below 1.2200 will add weight to sentiment and put focus back on critical support at the 1.2100 current year low of 13 January.