Published: 2025-04-08T07:29:53.000Z
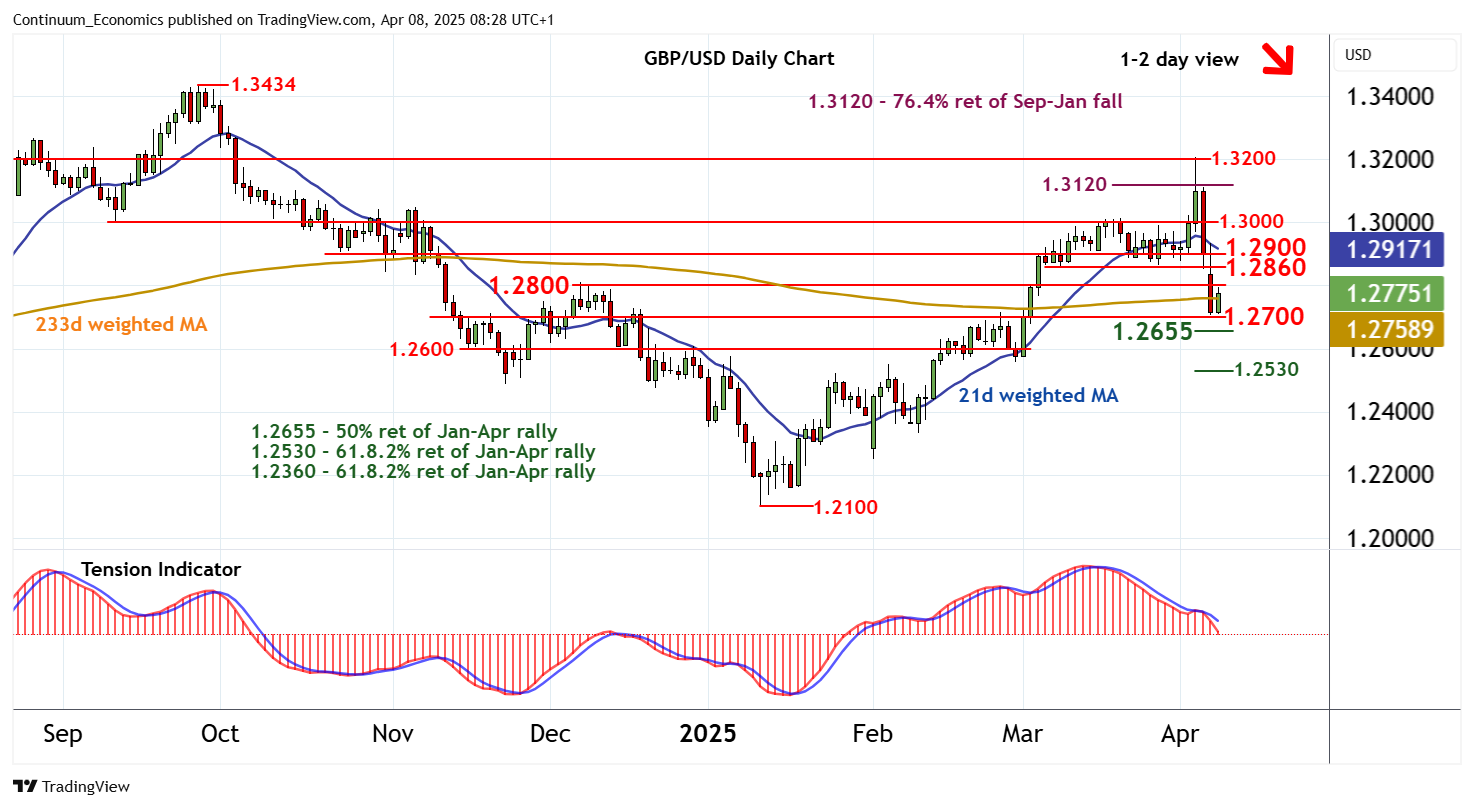
Chart GBP/USD Update: Reached 1.2700 - studies continue to track lower

Senior Technical Strategist
2
Anticipated losses have met expected buying interest at congestion support at 1.2700
| Level | Comment | Level | Comment | |||||
|---|---|---|---|---|---|---|---|---|
| R4 | 1.3000 | ** | range highs | S1 | 1.2700 | congestion | ||
| R3 | 1.2900 | ** | congestion | S2 | 1.2655 | ** | 50% ret of Jan-Apr rally | |
| R2 | 1.2860 | * | 6-10 Mar lows | S3 | 1.2600 | * | congestion | |
| R1 | 1.2800 | ** | congestion | S4 | 1.2530 | ** | 61.8% ret of Jan-Apr rally |
Asterisk denotes strength of level
08:10 BST - Anticipated losses have met expected buying interest at congestion support at 1.2700. Unwinding oversold intraday studies are prompting a bounce towards congestion resistance at 1.2800. But negative daily readings and deteriorating weekly charts are expected to limit any tests above here in renewed selling interest towards the 1.2860 lows from 6-10 March. Following cautious trade, fresh losses are looked for. A break below 1.2700 will add weight to sentiment and extend April losses towards the 1.2655 Fibonacci retracement. Beneath here is congestion around 1.2600.