Published: 2026-03-31T07:05:58.000Z
Chart GBP/JPY Update: Under pressure
1
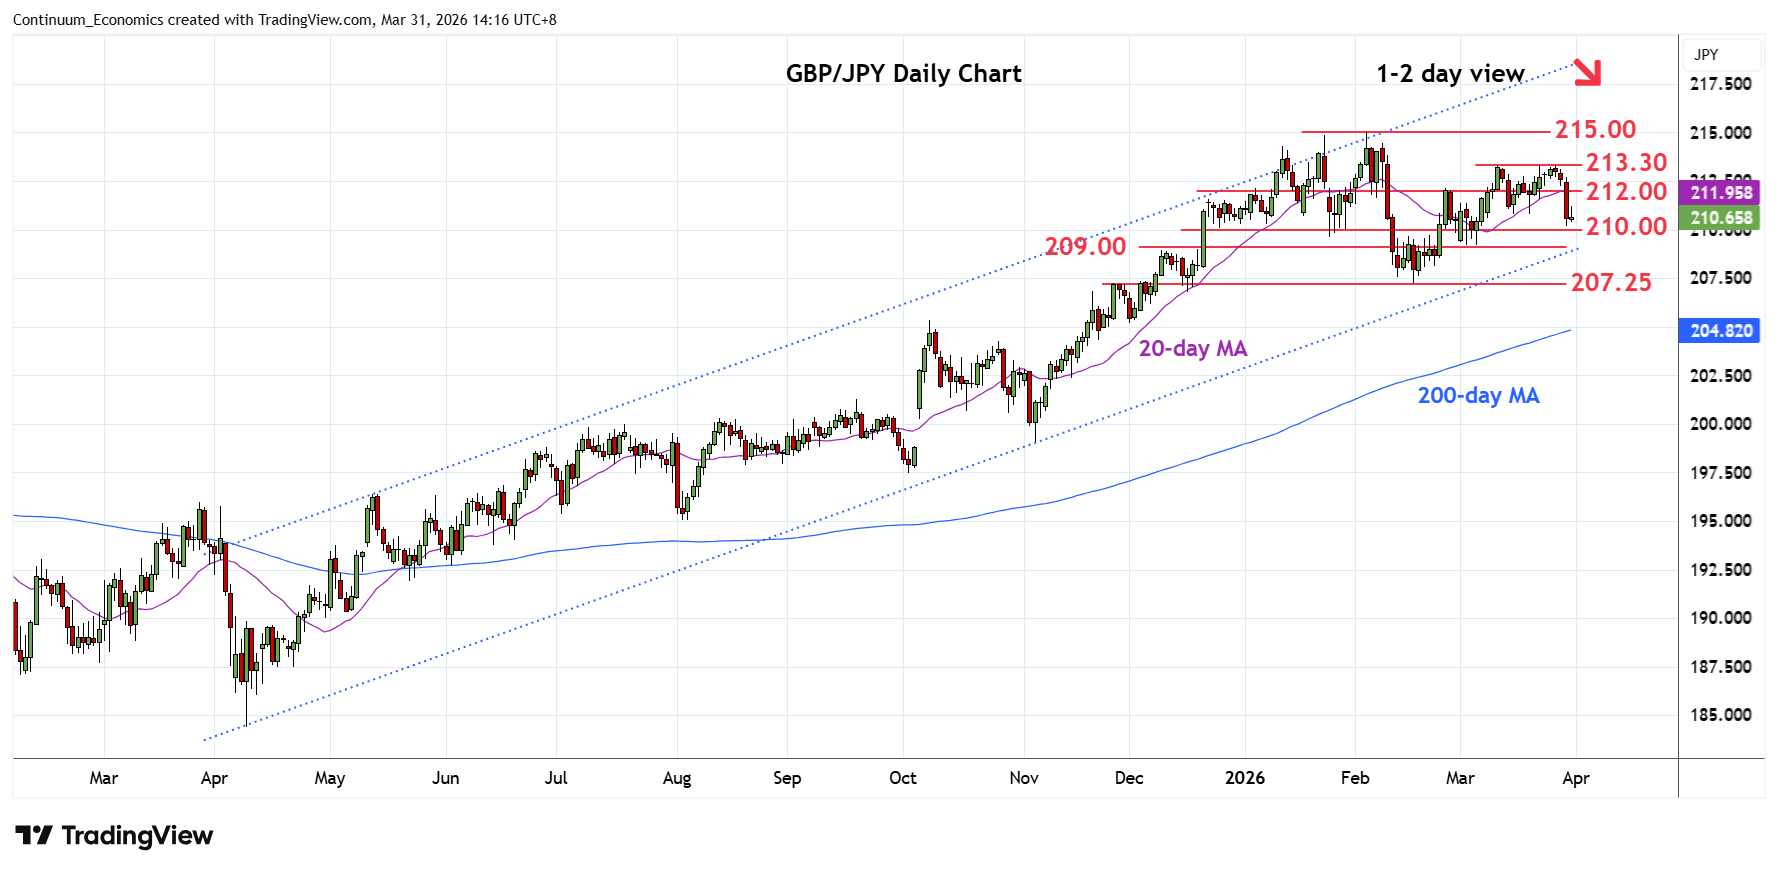
Break of the 212.00 level has seen sharp losses to approach the 210.00 support as prices retrace the February/March rally
| Levels | Imp | Comment | Levels | Imp | Comment | |||
|---|---|---|---|---|---|---|---|---|
| R4 | 215.00 | ** | 4 Feb YTD high | S1 | 210.00 | ** | congestion | |
| R3 | 214.00 | * | congestion | S2 | 209.20/00 | * | 3 Mar low, channel | |
| R2 | 213.30 | ** | 11 Mar high | S3 | 208.00 | congestion | ||
| R1 | 212.00 | * | congestion | S4 | 207.25 | * | 17 Feb YTD low |
Asterisk denotes strength of level
07:00 GMT - Break of the 212.00 level has seen sharp losses to approach the 210.00 support as prices retrace the February/March rally. Negative daily and weekly studies highlights risk for break here to open up room to the 209.20/00 congestion and channel support from the April 2025 low. Below this will return focus to the 207.25 February current year low and see risk for break to extend losses from the 215.00 February high. Meanwhile, resistance is lowered to 212.00 level which is expected to cap and sustain losses from the 213.30 highs.