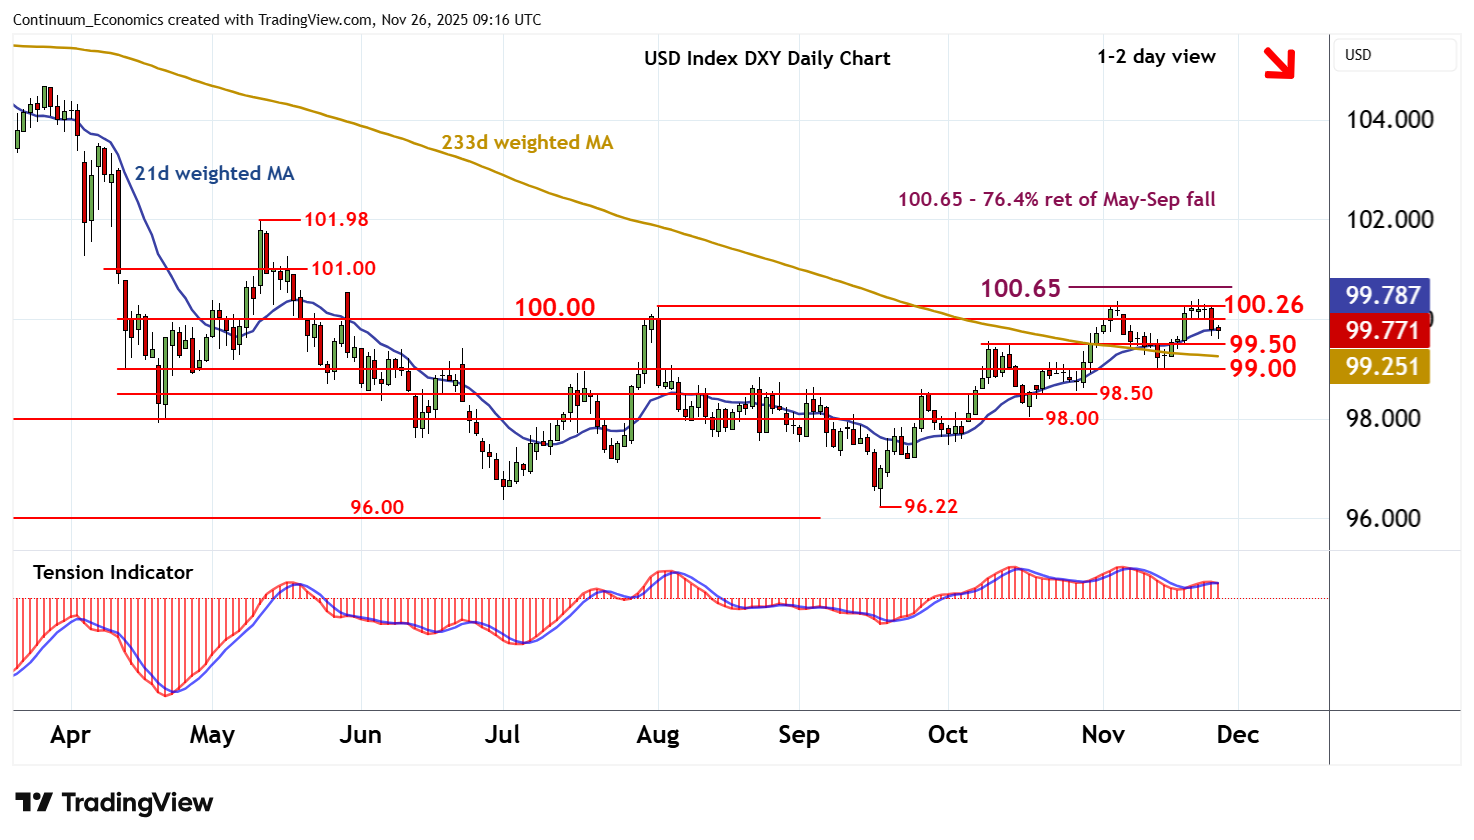
Chart USD Index DXY Update: Leaning lower
Cautious trade within strong resistance at congestion around 100.00 and the 100.26 monthly high of 1 August has given way to the anticipated pullbac
| Levels | Imp | Comment | Levels | Imp | Comment | |||
|---|---|---|---|---|---|---|---|---|
| R4 | 100.65 | ** | 76.4% ret of May-Sep fall | S1 | 99.50 | * | break level | |
| R3 | 100.54 | ** | 29 May (w) high | S2 | 99.00 | * | congestion | |
| R2 | 100.26 | ** | 1 Aug (m) high | S3 | 98.50 | * | congestion | |
| R1 | 100.00 | ** | congestion | S4 | 98.00 | * | congestion |
Asterisk denotes strength of level
09:05 GMT - Cautious trade within strong resistance at congestion around 100.00 and the 100.26 monthly high of 1 August has given way to the anticipated pullback, with prices reaching 99.60 before settling into consolidation around 99.75. Daily readings have turned down and overbought weekly stochastics are falling, highlighting room for further losses in the coming sessions. A break below support at the 99.50 break level will open up congestion around 99.00. But the rising weekly Tension Indicator is expected to limit any initial tests in renewed consolidation. Meanwhile, a close above 100.00/26 is needed to turn sentiment positive and extend mid-September gains towards the 100.65 Fibonacci retracement, where mixed weekly charts could prompt fresh selling interest/consolidation.