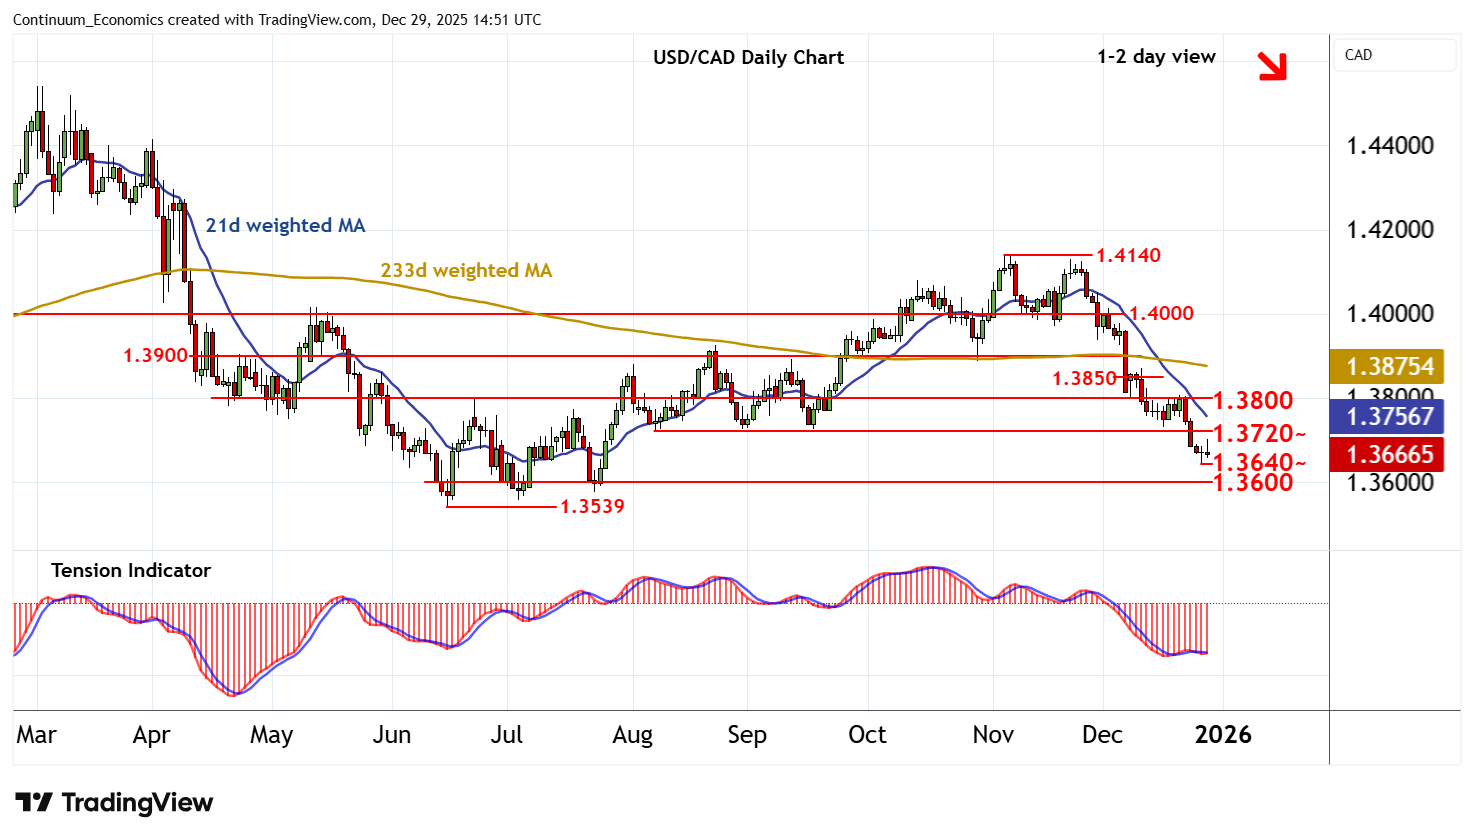
Chart USD/CAD Update: Prices remain under pressure
Anticipated losses have reached 1.3640
| Levels | Imp | Comment | Levels | Imp | Comment | |||
|---|---|---|---|---|---|---|---|---|
| R4 | 1.3900 | ** | break level | S1 | 1.3640 | * | 26 Dec (w) low | |
| R3 | 1.3850 | congestion | S2 | 1.3600 | * | congestion | ||
| R2 | 1.3800 | ** | congestion | S3 | 1.3539 | ** | 16 Jun YTD low | |
| R1 | 1.3720~ | ** | Aug-Sep lows | S4 | 1.3500 | ** | congestion |
Asterisk denotes strength of level
14:45 GMT - Anticipated losses have reached 1.3640, where mixed intraday studies and flat oversold daily stochastics are prompting short-term reactions. The daily Tension Indicator continues to point lower and broader weekly charts are mixed/negative, highlighting room for further losses in the coming sessions. A break beneath here will add weight to sentiment and extend November losses towards congestion around 1.3600. However, flat oversold weekly stochastics should limit any immediate break in short-covering/consolidation above critical support at the 1.3539 current year low of 16 June. Meanwhile, resistance remains at the 1.3720~ lows from August-September. A close above here, if seen, would help to stabilise price action and prompt consolidation beneath congestion around 1.3800.