Chartbook: Chart AUD/USD: Retracing losses from 2021 year high
Sideway ranging action in Q3 within the .6600/.6400 area gave way to break of the .6600/.6625 resistance and a 4-1/2 year trend-line from February 2021 year high
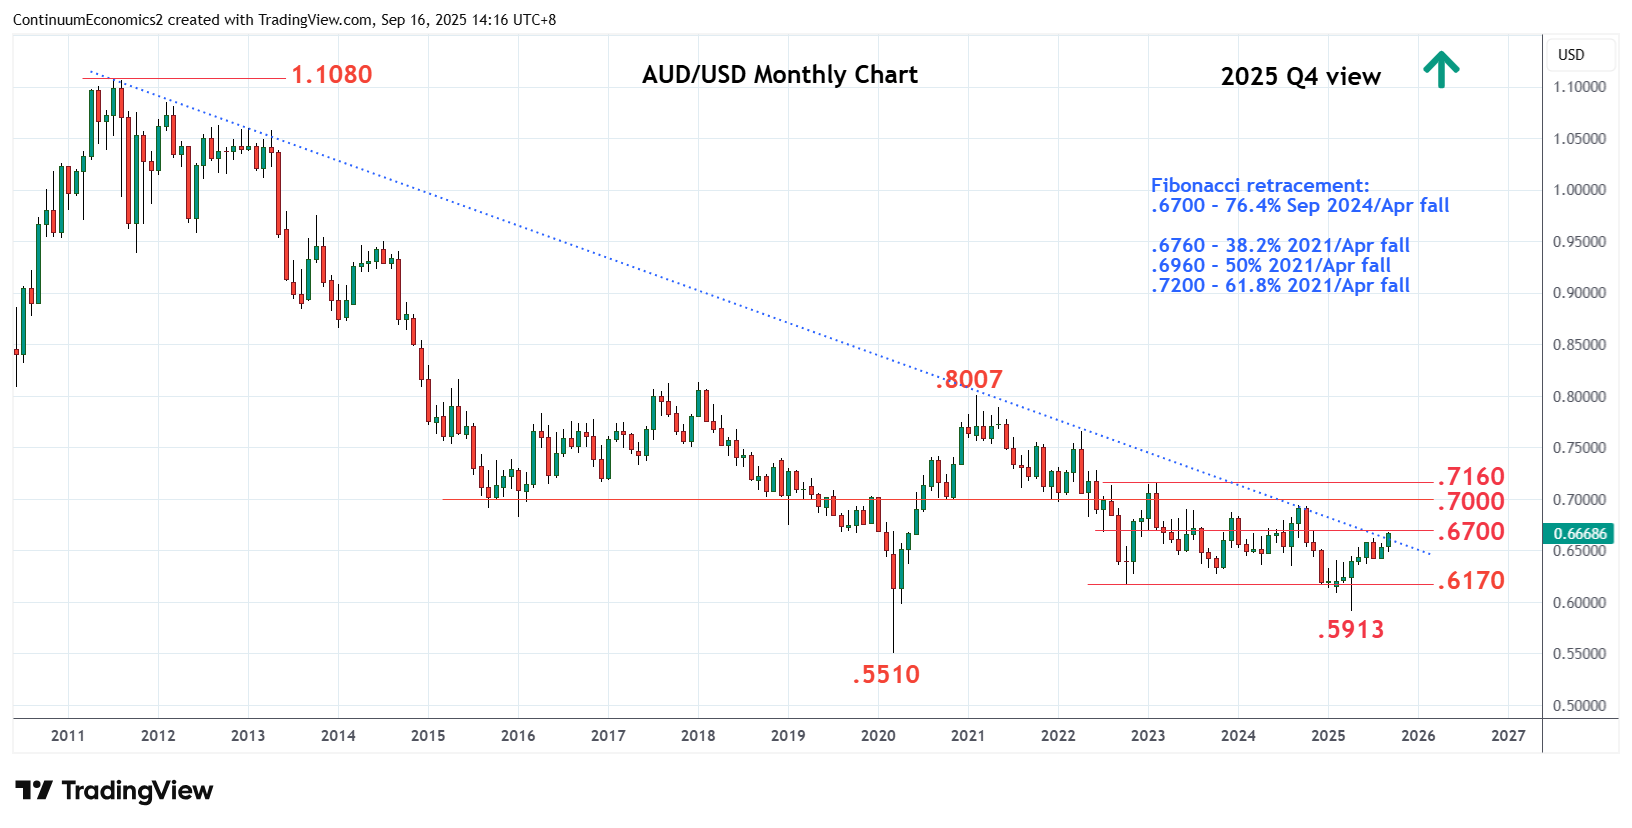
Sideway ranging action in Q3 within the .6600/.6400 area gave way to break of the .6600/.6625 resistance and a 4-1/2 year trend-line from the February 2021 year high. This coincides with an even more significant break of trend-line from the 2011 year high, suggesting reversal of the long-term bear trend.
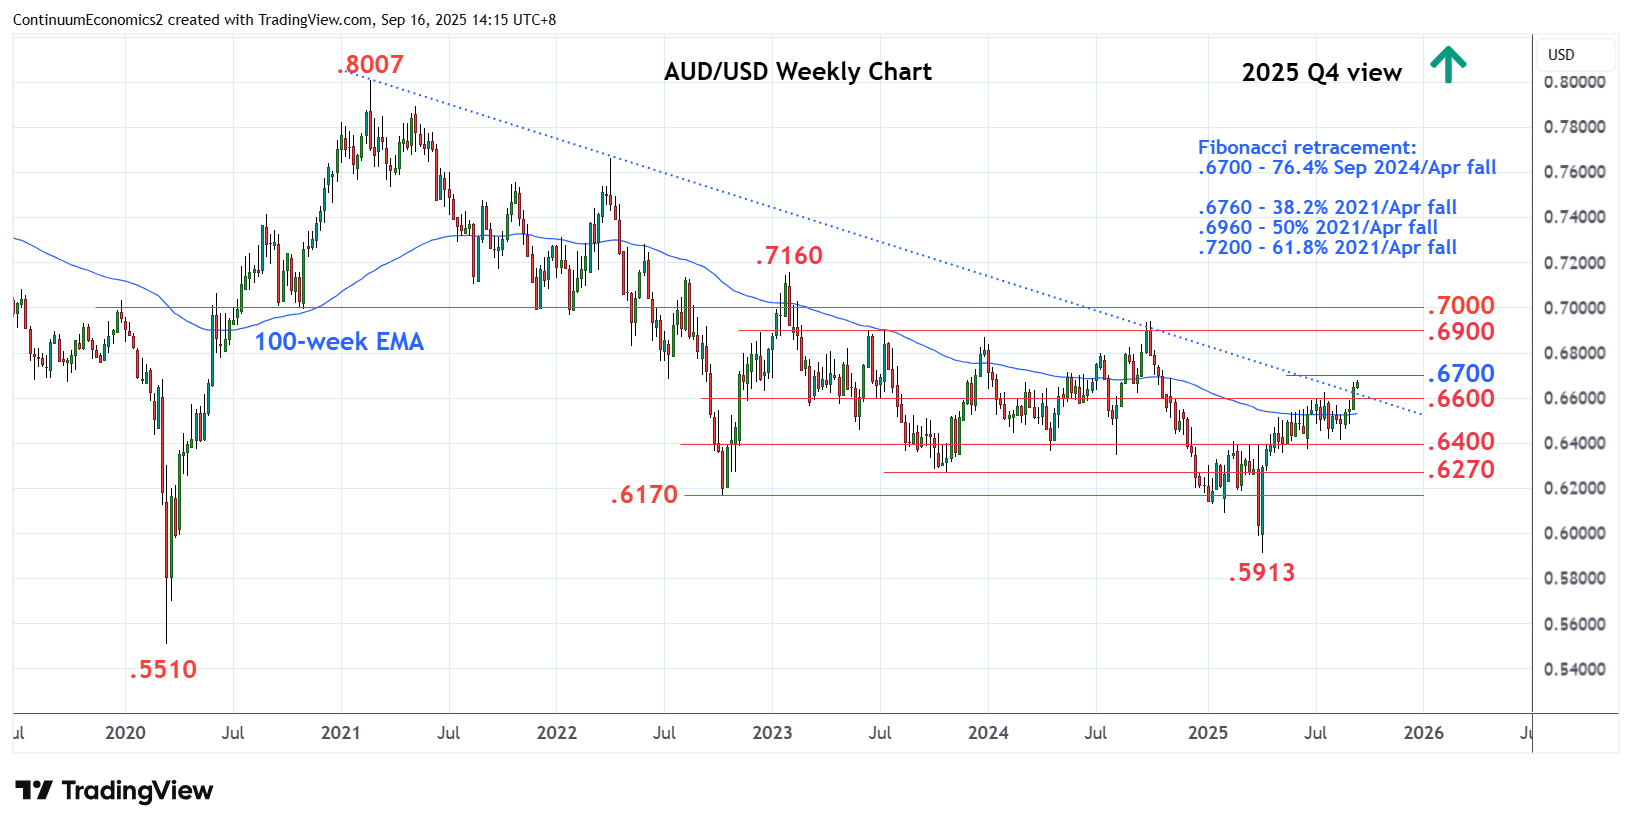
This break opens up room for stronger recovery to extend gains from the .5913 April low with the .6700 level now within reach. Clearance here will see room for stronger gains to retrace losses from the 2021 year high to target .6760, 38.2% Fibonacci level. Break here open up room to the strong resistance at .6960/.7000, the 50% Fibonacci level and congestion area. Gains beyond this will turn focus to the 2023 year high at .7160 then the .7200, 61.8% Fibonacci level.
Meanwhile, support is raised to the .6500 congestion and this extend the .6415/00 area which is expected to underpin and sustain gains from the .5913, April higher low.