Published: 2025-09-05T11:52:15.000Z
Chart USD/ZAR Update: Back in range
0
-
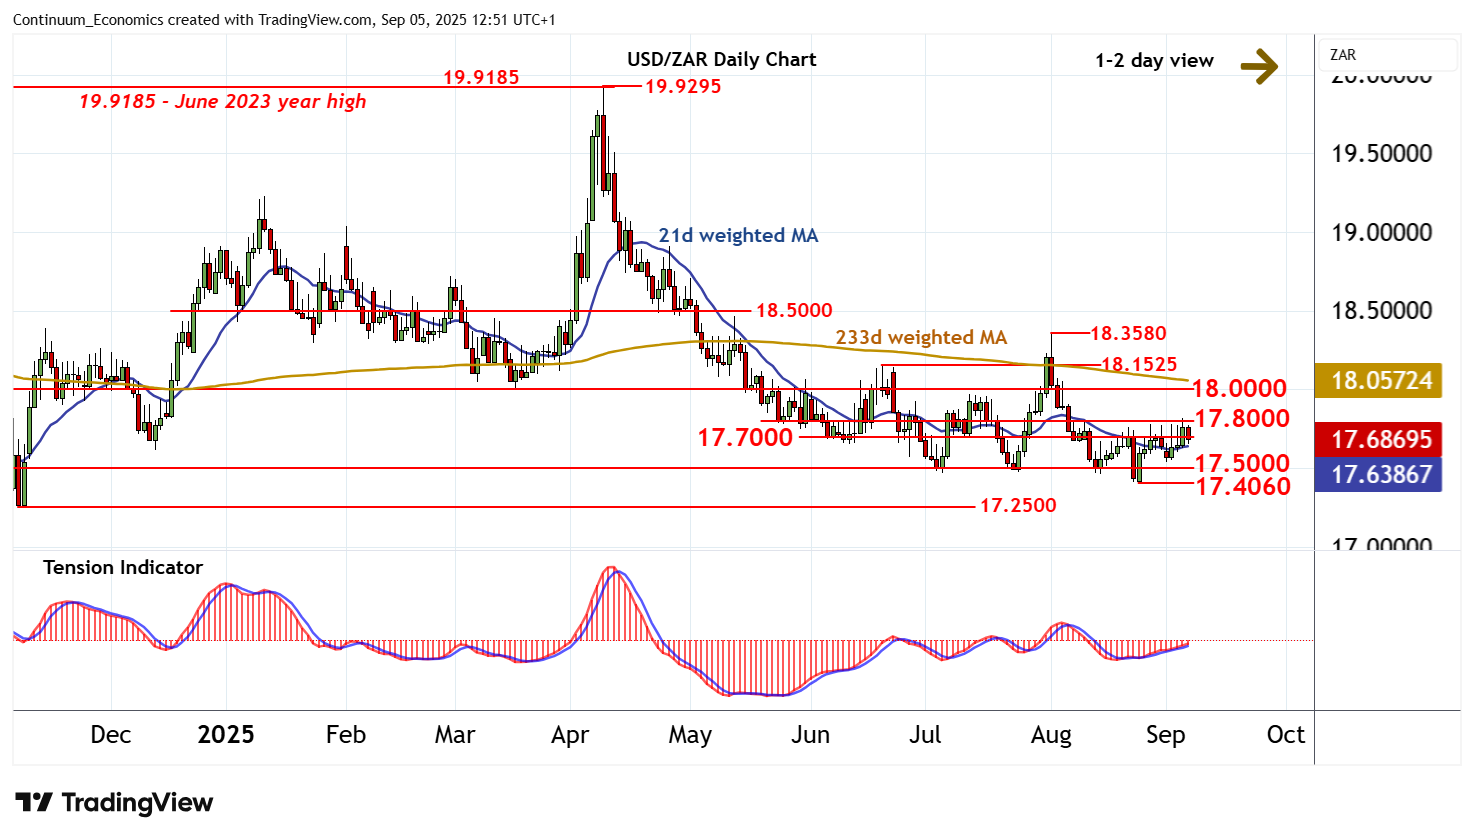
The anticipated test of congestion resistance at 17.8000 has been pushed back
| Level | Comment | Level | Comment | |||||
|---|---|---|---|---|---|---|---|---|
| R4 | 18.1525 | ** | 19 Jun (m) high | S1 | 17.5000 | ** | congestion | |
| R3 | 18.0000 | ** | congestion | S2 | 17.4060 | ** | 25 Aug YTD low | |
| R2 | 17.8000 | * | congestion | S3 | 17.2500 | ** | 7 Nov (m) low | |
| R1 | 17.7000 | * | congestion | S4 | 17.0315 | ** | 30 Sep 2024 (y) low |
Asterisk denotes strength of level
12:10 BST - The anticipated test of congestion resistance at 17.8000 has been pushed back, as intraday studies turn down, with prices currently trading just below congestion resistance at 17.7000. Overbought daily stochastics are flattening, suggesting a cautious tone and room for a deeper pullback. But the rising daily Tension Indicator and mixed weekly charts are expected to limit initial scope in renewed consolidation above congestion support at 17.5000. A close below critical support at the 17.4060 current year low would add weight to sentiment and extend April losses towards the 17.0315 year low of 30 September 2024.