Continuum Economics
  • Search
  • About Us
  • Buy
  • Invite A Friend
  • My Basket
  • Articles
  • Calendar
  • Forecasts
  • Events
  • Data
  • Newsletters
  • My Alerts
  • Community
  • Directory
  • About Us
  • Buy
  • Invite A Friend
  • My Basket
  • Articles
    • All
    • Thematic
    • Tactical
    • Asia
    • EMEA
    • Americas
    • Newsletters
    • Freemium
    • Editor's Choice
    • Most Viewed
    • Most Shared
    • Most Liked
  • Calendar
    • Interactive
      • China
      • United States
      • Eurozone
      • United Kingdom
    • Month Ahead
    • Reviews
    • Previews
  • Forecasts
    • Forecasts
    • Key Views
  • Events
    • Media
    • Conference Calls
  • Data
    • Country Insights
    • Shadow Credit Ratings
    • Full CI Data Download
  • Newsletters
  • My Alerts
  • Community
    • FX
    • Fixed Income
    • Macro Strategy
    • Credit Markets
    • Equities
    • Commodities
    • Precious Metals
    • Renewables
  • Directory
  • My Account
  • Notifications Setup
  • Administration Panel
  • Account Details
  • Recent Devices
  • Distribution Lists
  • Shared Free Trials
  • Saved Articles
  • Shared Alerts
  • My Posts
Published: 2025-09-11T07:45:39.000Z

Chartbook: U.S. Chart S&P 500: Extending gains but bullish momentum slows

0
4

Steady gains in Q3 see market extending to fresh record highs to reach the 6500/6600, upper channel area.

Rebound from the 4835 April corrective low, just above the channel support from the 2020 year low at 4800, saw gains to retest the 6147 February record high at the end of Q2. Subsequent break and steady gains in Q3 see market extending to fresh record highs to reach the 6500/6600, upper channel area.

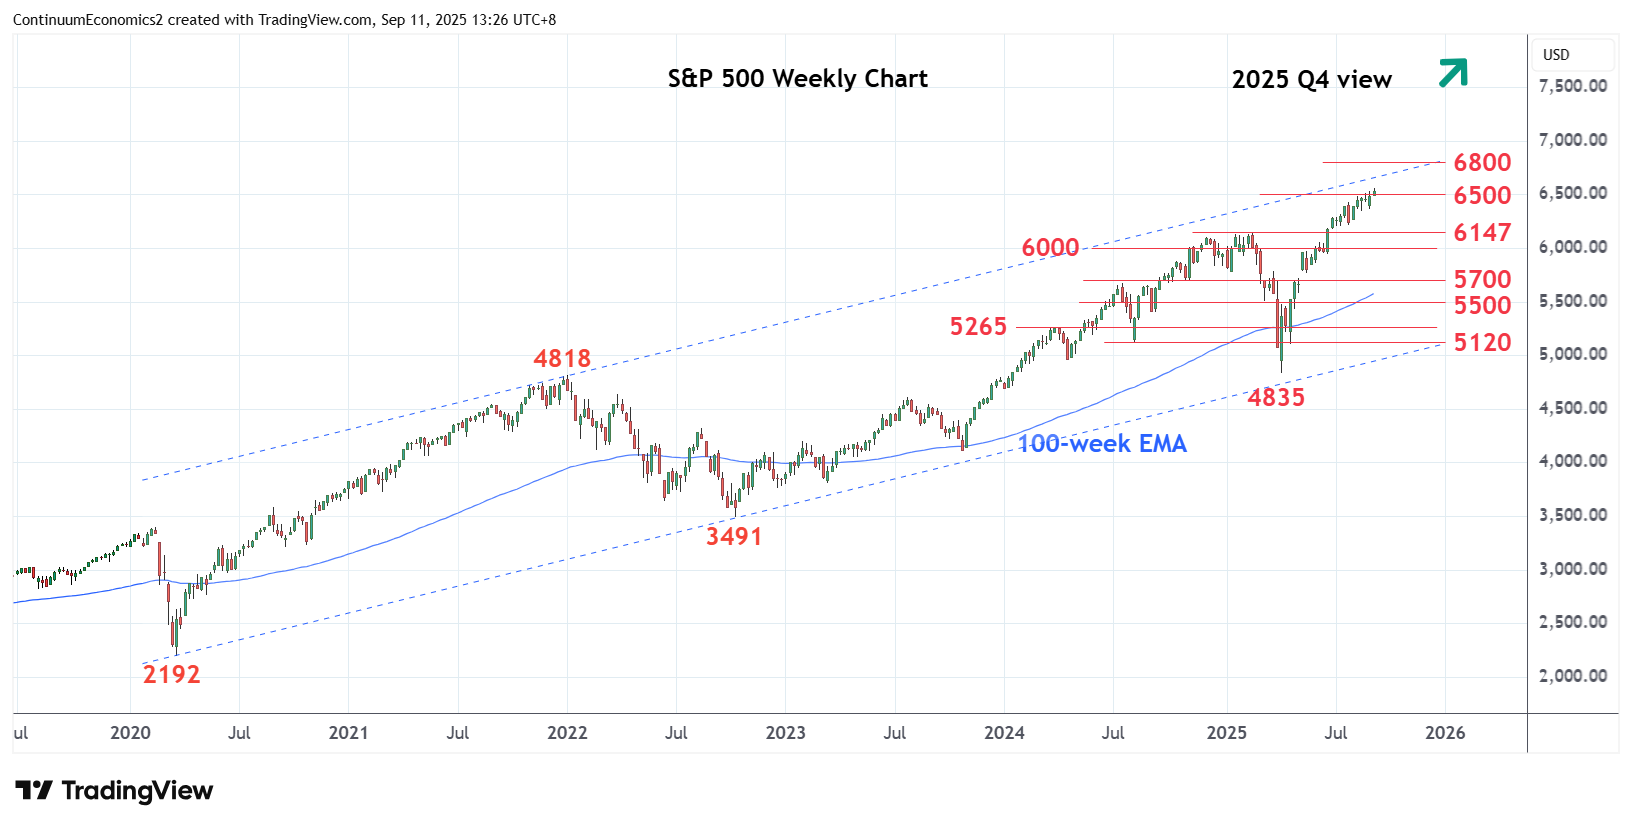
Overbought daily and weekly studies see bullish momentum showing signs of fading. However, further gains cannot be ruled out as gains extend higher towards the upper boundary of the bull channel to the 6800 level going into the year end. Would expect reaction here to unwind overbought readings on daily and weekly studies. Clearance of the 6800 level, if seen, will see room to the 7000 psychological level.

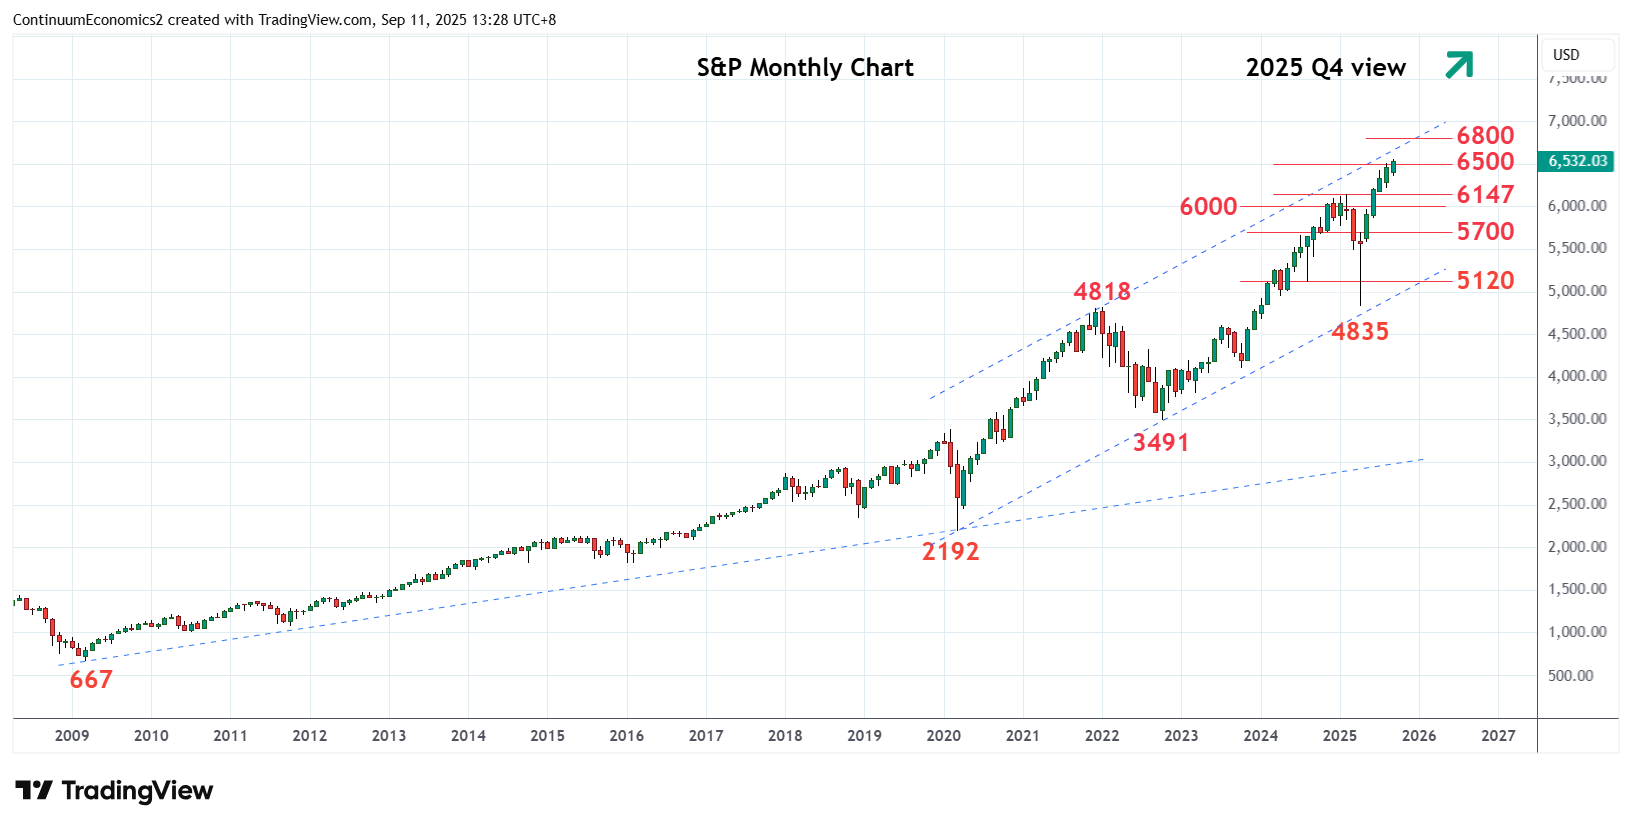
Meanwhile, support is at the 6147 February high and this extend to the 6000 psychological level. Failure to hold this will open up room for deeper correction to the 5700/5500 congestion area.

Continue to read the article for free
Login

or

or

Topics
US S&P Comp.-TA
Technical Analysis
ChartBook

GENERAL

  • Home
  • About Us
  • Our Team
  • Careers

LEGAL

  • Terms and Conditions
  • Privacy Policy
  • Compliance
  • GDPR

GET IN TOUCH

  • Contact Us
Continuum Economics
The Technical Analyst Awards Winner 2021
The Technical Analyst Awards Finalist 2020
image