Published: 2025-07-29T02:45:46.000Z
Chart USD/KRW Update: Consolidating retest of 1395.00/1400.00

Technical Analyst
-
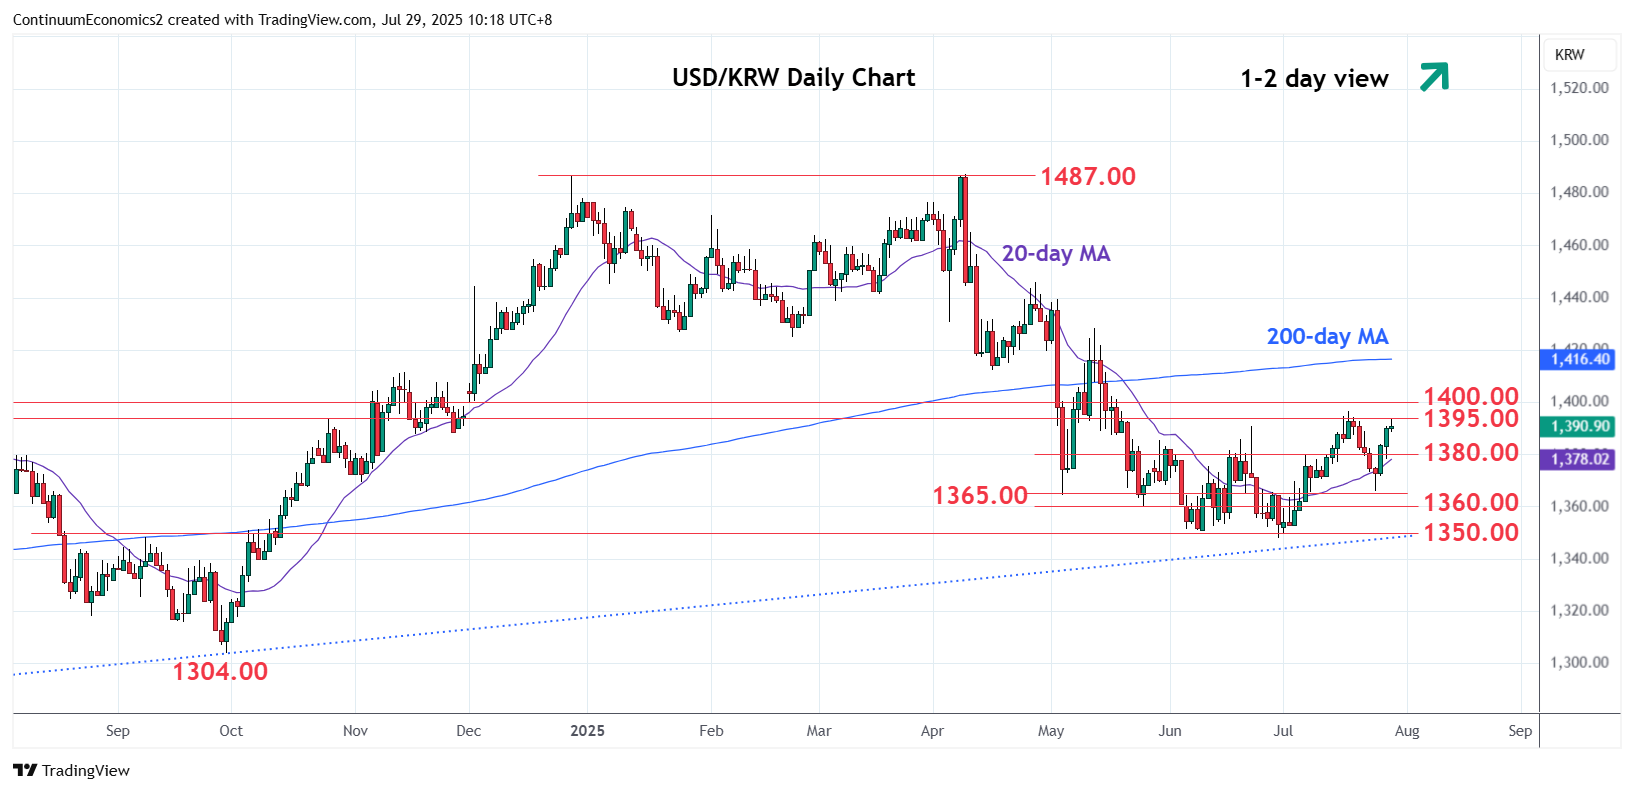
Bounce from the 1365.00/1360.00 support see prices back to retest strong resistance at the 1395.00/1400.00 area
| Levels | Imp | Comment | Levels | Imp | Comment | |||
|---|---|---|---|---|---|---|---|---|
| R4 | 1418.00 | * | 50% Apr/Jun fall | S1 | 1380.00 | * | congestion | |
| R3 | 1412.00 | ** | Apr low | S2 | 1365.00 | ** | 24 Jul low | |
| R2 | 1400.00 | ** | Apr 2024 high, 38.2% | S3 | 1360.00 | * | 26 May low | |
| R1 | 1395.00 | * | Jun 2024 high | S4 | 1348.00 | ** | 30 Jun YTD low |
Asterisk denotes strength of level
02:40 GMT - Bounce from the 1365.00/1360.00 support see prices back to retest strong resistance at the 1395.00/1400.00 area. Consolidation here see prices unwinding overbought intraday studies but rising daily chart suggest scope for break here to open up stronger gains to retrace the April/June losses. Higher will see scope to the April low at 1412.00 and 1418, 50% Fibonacci level. Meanwhile, support is raised to 1380.00 which should underpin and sustain bounce from the 1365.00 low.