Published: 2026-02-19T01:10:15.000Z
Chart USD/JPY Update: Retracing losses last week
2
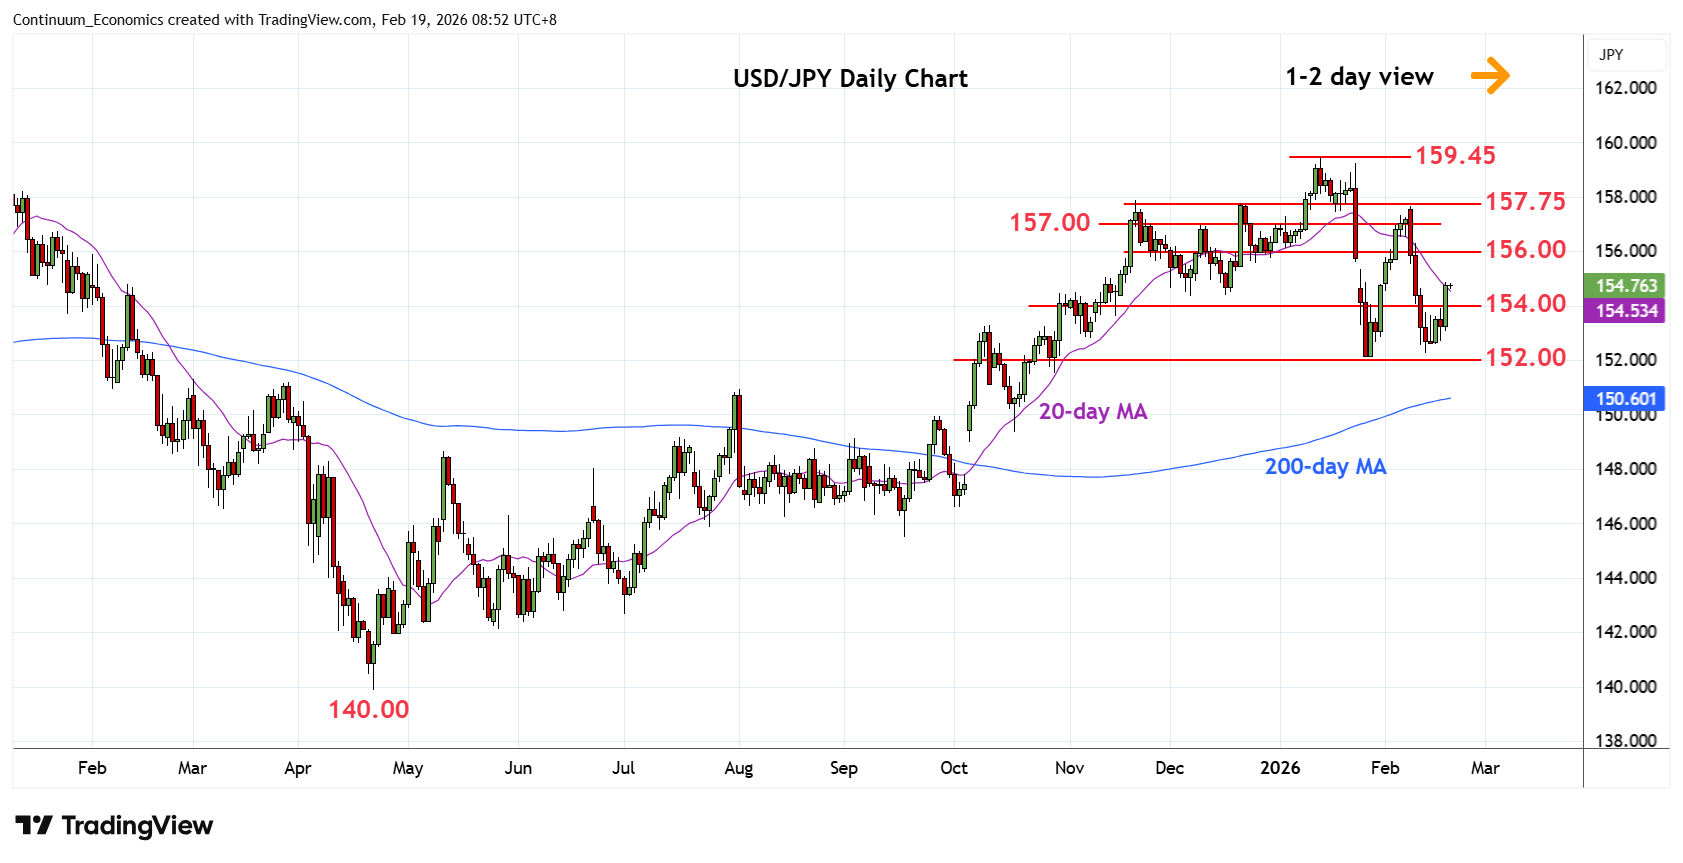
Regaining the 154.00 level see prices extending bounce from the 152.27 low to retrace sharp losses last week
| Levels | Imp | Comment | Levels | Imp | Comment | |||
|---|---|---|---|---|---|---|---|---|
| R4 | 157.75/90 | ** | Dec, Nov highs | S1 | 154.00 | * | congestion | |
| R3 | 157.00 | * | congestion | S2 | 153.00 | * | 23 Jan low | |
| R2 | 156.00 | * | congestion | S3 | 152.27 | * | 12 Feb low | |
| R1 | 155.00 | * | congestion | S4 | 152.10 | ** | 27 Jan YTD low |
Asterisk denotes strength of level
01:00 GMT - Regaining the 154.00 level see prices extending bounce from the 152.27 low to retrace sharp losses last week from the 157.66 high. Bounce seen corrective with resistance at the 155.00/156.00 congestion area expected to cap and give way to renewed selling pressure later. Clearance, if seen, will open up room for stronger bounce to 157.75.90 resistance. Meanwhile, support is raised to the 154.00/153.00 area. Would take break here to return focus to the downside for retest of the 152.27 and 152.10 lows.