Published: 2026-03-06T00:29:25.000Z
Chart AUD/USD Update: Leaning lower in consolidation
2
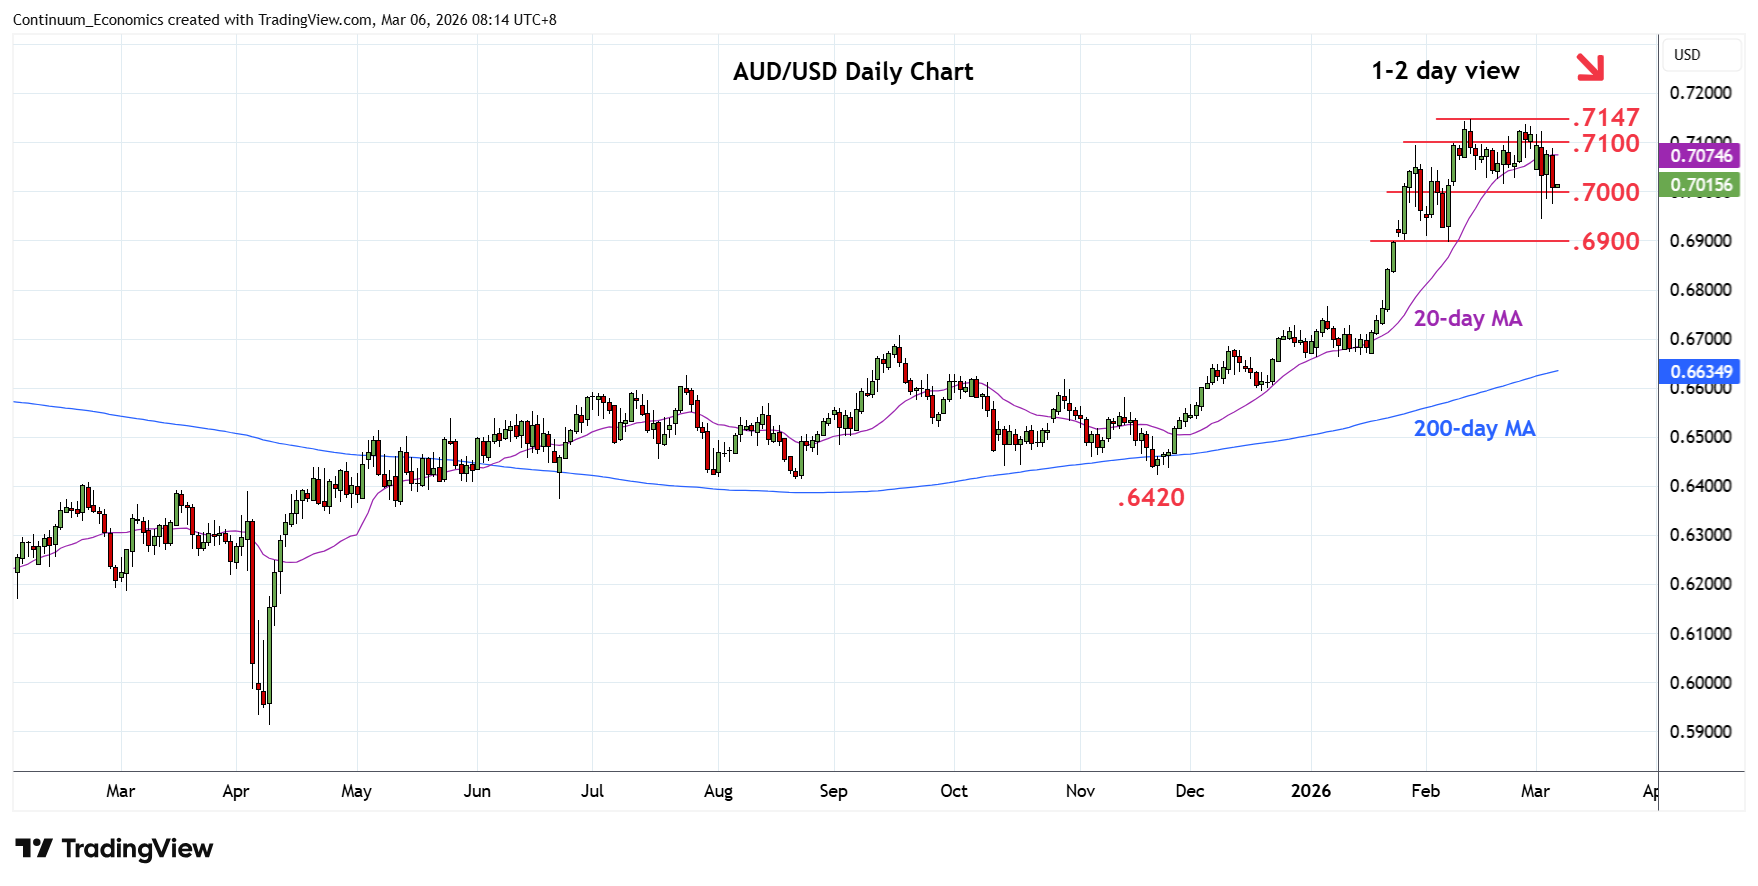
Lower in consolidation within the .7100/.7000 range area to pressure the .7015/00 support
| Levels | Imp | Comment | Levels | Imp | Comment | |||
|---|---|---|---|---|---|---|---|---|
| R4 | 0.7280 | * | Jun 2022 high | S1 | 0.7015/00 | * | 20 Feb low, congestion | |
| R3 | 0.7205 | * | 61.8% 2021/2025 fall | S2 | 0.6945 | * | 3 Mar low | |
| R2 | 0.7147 | ** | 12 Feb YTD high | S3 | 0.6900 | ** | congestion, 6 Feb low | |
| R1 | 0.7100 | * | congestion | S4 | 0.6870 | * | 38.2% Nov/Feb rally |
Asterisk denotes strength of level
00:15 GMT - Lower in consolidation within the .7100/.7000 range area to pressure the .7015/00 support. Negative daily studies weighs and suggest scope for break here to confirm a double top at the .7137/.7147 February highs. Lower will open up room for retest of .6945 Tuesday's low then the .6900, February low. Below these will see further losses to retrace rally from the .6420, November low. Meanwhile, resistance remains at the .7100 which is expected to cap upside test. Would take break here to see return to the .7137/.7147 highs.