Published: 2025-12-02T06:45:54.000Z
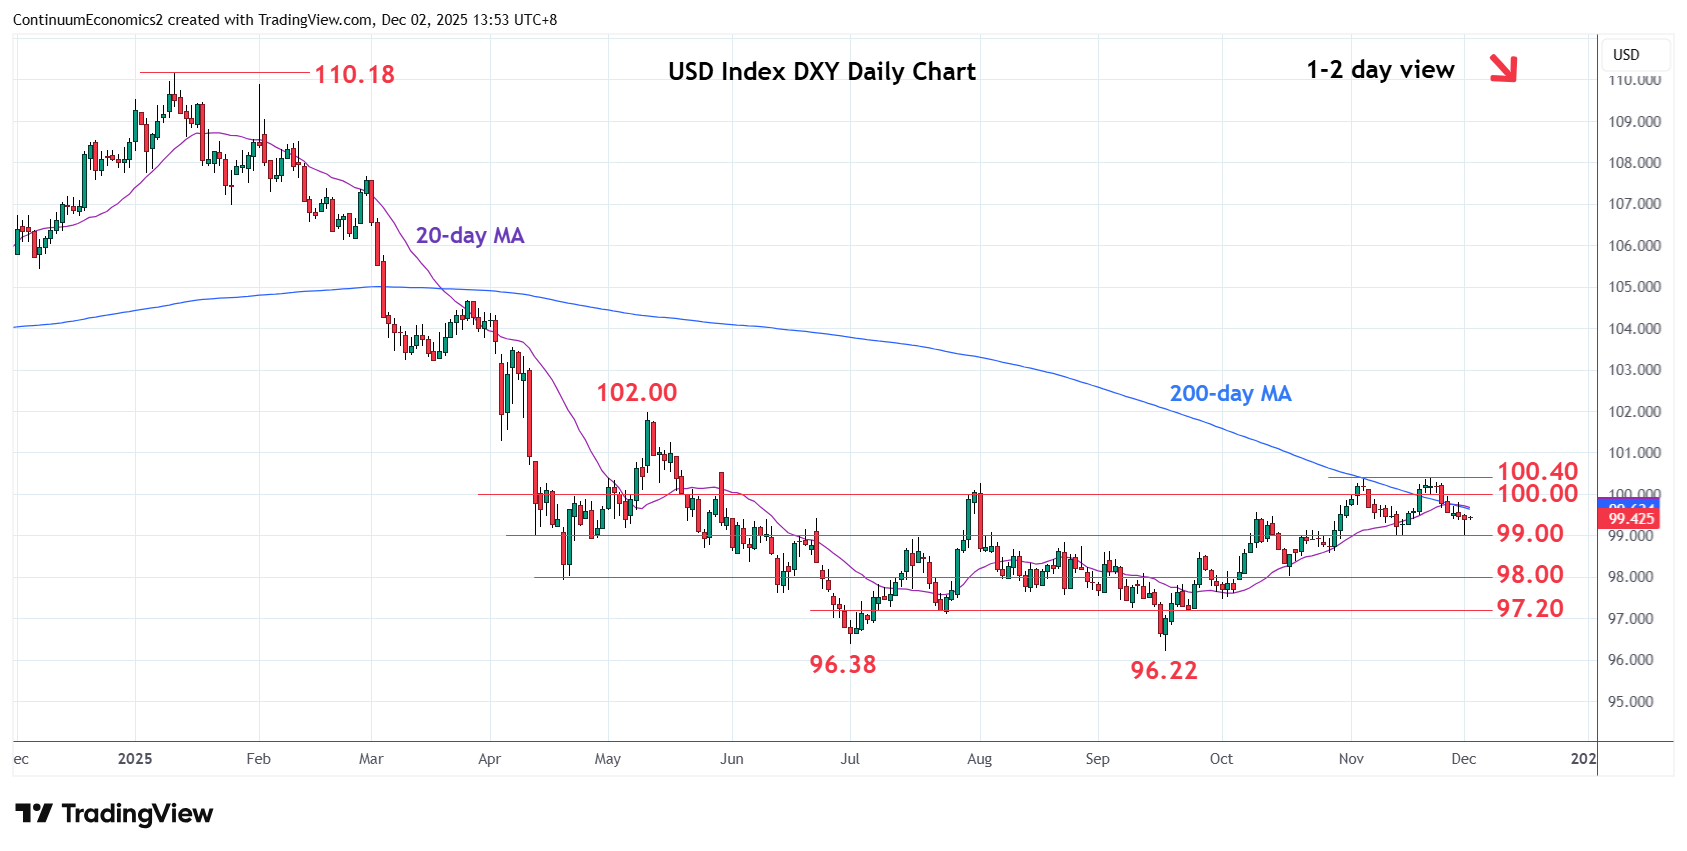
Chart USD Index DXY Update: Consolidating at 99.00, November range low
2
Bounce at the 99.00 support see prices consolidating losses from the 100.40, November range high
| Levels | Imp | Comment | Levels | Imp | Comment | |||
|---|---|---|---|---|---|---|---|---|
| R4 | 101.00 | * | congestion | S1 | 99.00 | * | congestion | |
| R3 | 100.40 | ** | 21 Nov high | S2 | 98.56 | * | 28 Oct low | |
| R2 | 100.00 | * | congestion | S3 | 98.00 | * | April low, congestion | |
| R1 | 99.50 | * | congestion | S4 | 97.20 | * | 1 Oct low |
Asterisk denotes strength of level
06:40 GMT - Bounce at the 99.00 support see prices consolidating losses from the 100.40, November range high. Would take break of the 99.00 level to confirm a double top at the 100.36/100.40 highs and see deeper pullback to retrace gains from the 96.22, September YTD low. Lower will see room for extension to the 98.56 support then 98.00, April low and congestion area. Break of these will return focus to the downside for retest of 97.20/97.00 area. Meanwhile, resistance is lowered to 99.50/100.00 congestion area which is expected to cap and sustain losses from the 100.40 high.