Published: 2026-01-07T07:00:44.000Z
Chart AUD/NZD Update: Extending gains
1
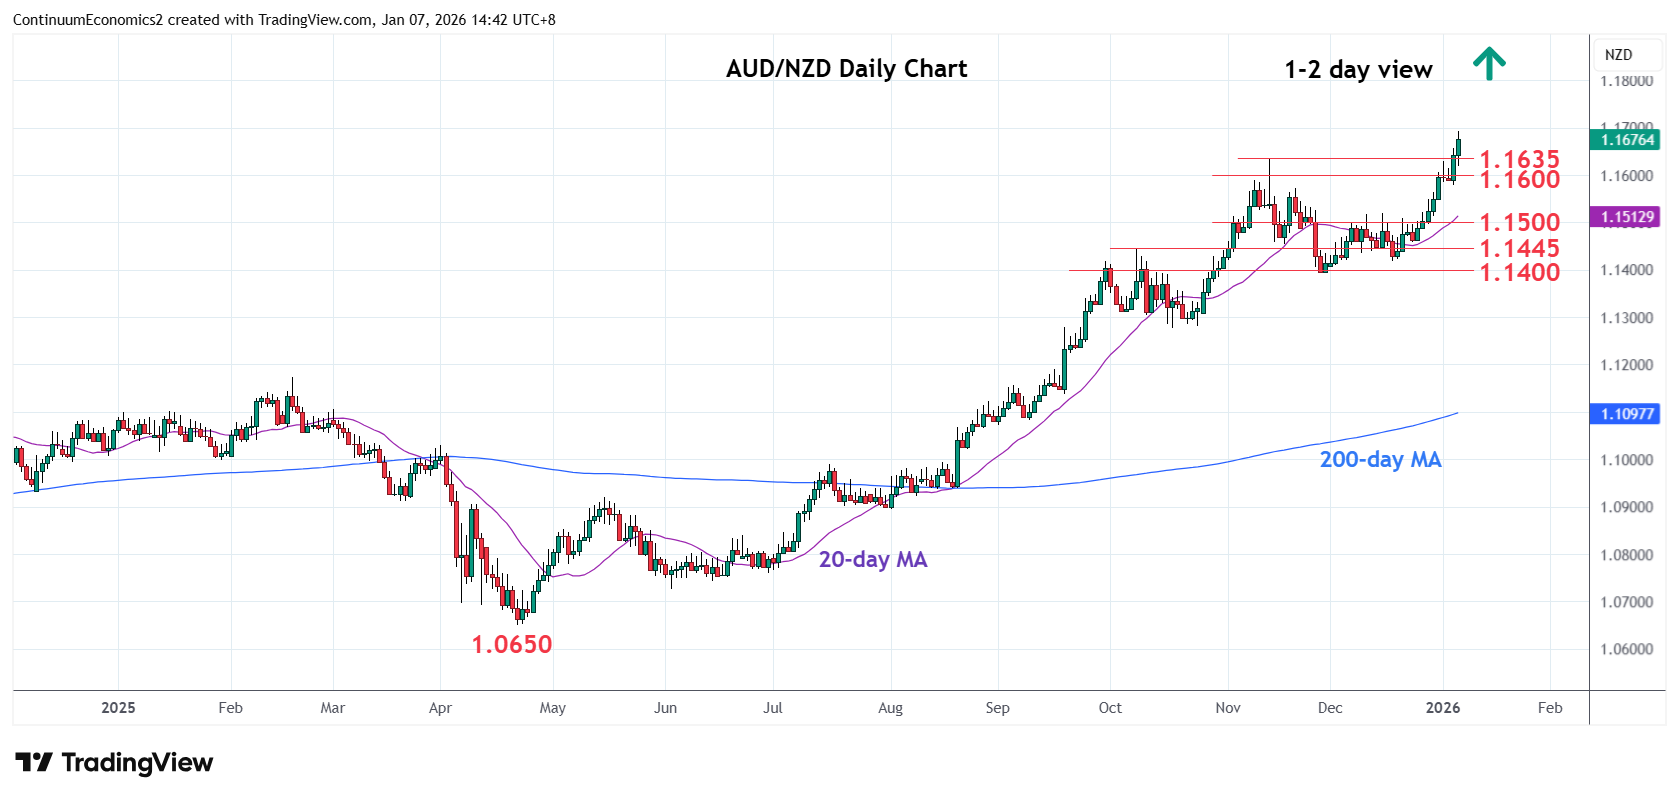
Break above the November 2025 year high at 1.1635 see prices extending the underlying bull trend from the 2020 year low
| Level | Comment | Level | Comment | |||||
|---|---|---|---|---|---|---|---|---|
| R4 | 1.2000 | ** | figure, congestion | S1 | 1.1550 | * | congestion | |
| R3 | 1.1900 | * | 50% 2011/2020 fall | S2 | 1.1500 | * | congestion | |
| R2 | 1.1800/20 | * | congestion, May 2013 low | S3 | 1.1445 | * | Nov high | |
| R1 | 1.1700 | * | congestion | S4 | 1.1420/00 | ** | 17 Dec, Nov lows |
Asterisk denotes strength of level
07:00 GMT - Break above the November 2025 year high at 1.1635 see prices extending the underlying bull trend from the 2020 year low. Bullish structure see room for extension to resistance at the 1.1700 level then 1.1800/20 congestion area. Higher still, will see scope to 1.1900, 50% Fibonacci level. Meanwhile, support is raised to the 1.1550/1.1500 congestion area which is expected to underpin. Would take break here to fade the upside pressure and see room for deeper pullback to strong support at the 1.1445/1.1400, congestion and November low.