Chart GBP/USD Update: Studies improving

Cautious trade has given way to a fresh run higher
| Level | Comment | Level | Comment | |||||
|---|---|---|---|---|---|---|---|---|
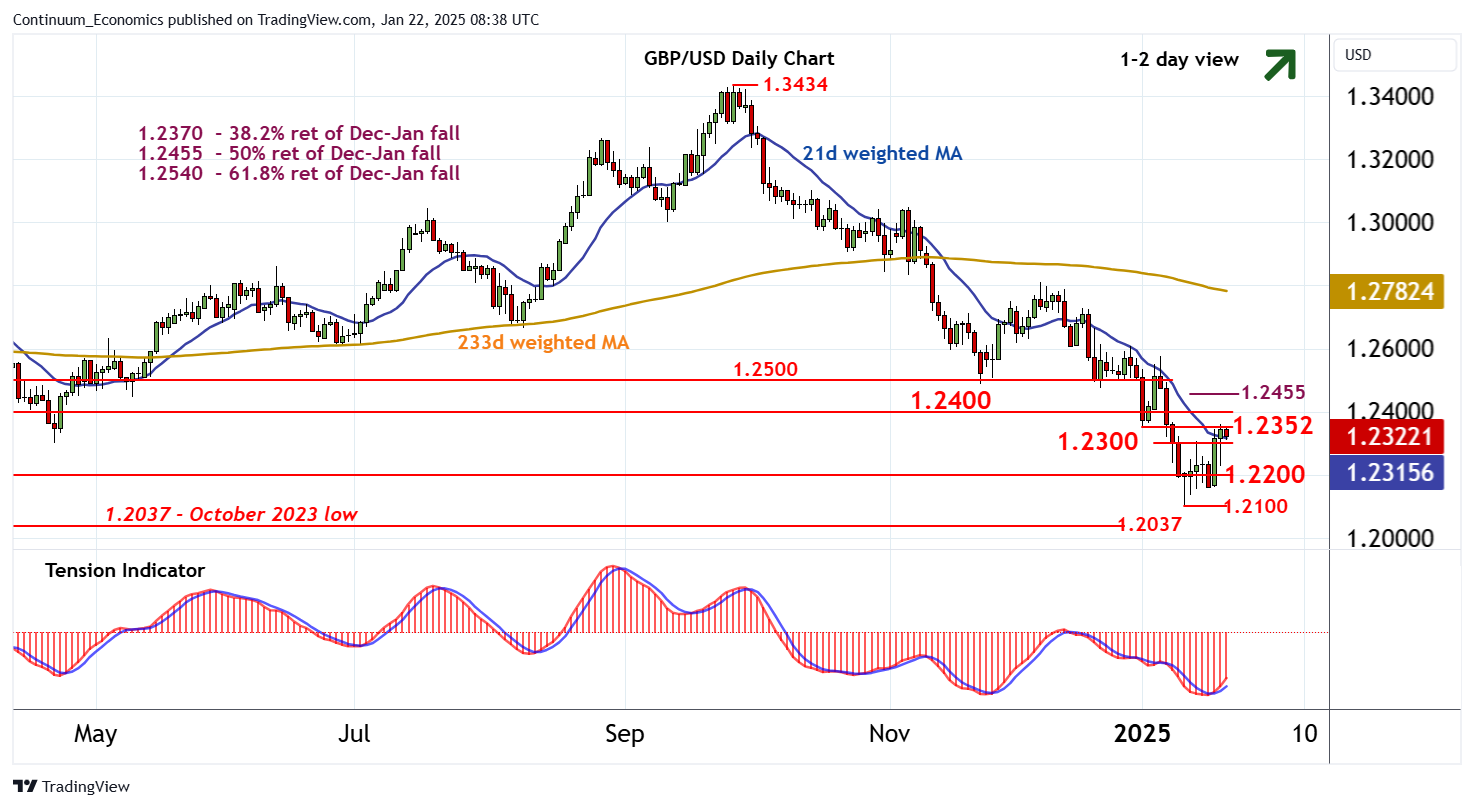
| R4 | 1.2455 | ** | 50% ret of Dec-Jan fall | S1 | 1.2300 | * | break level | |
| R3 | 1.2400 | minor congestion | S2 | 1.2200 | * | congestion | ||
| R2 | 1.2370 | * | 38.2% ret of Dec-Jan fall | S3 | 1.2160 | 17 Jan low | ||
| R1 | 1.2352 | * | 2 Jan (w) low | S4 | 1.2100 | ** | 13 Jan YTD low |
Asterisk denotes strength of level
08:10 GMT - Cautious trade has given way to a fresh run higher, with the break above 1.2300 giving way to consolidation beneath resistance at the 1.2352 weekly low of 2 January. Intraday studies are coming under pressure, suggesting potential for a test back below 1.2300. But rising daily readings and a tick higher in oversold weekly stochastics are expected to limit scope in renewed buying interest above congestion support at 1.2200. Following cautious trade, fresh gains are looked for. A break above 1.2352 will improve sentiment and open up resistance at the 1.2370 Fibonacci retracement and congestion around 1.2400. Continuation beyond here will open up the 1.2455 retracement.