Published: 2026-02-24T01:50:40.000Z
Chart GBP/USD Update: Limited above the 1.3500 level
1
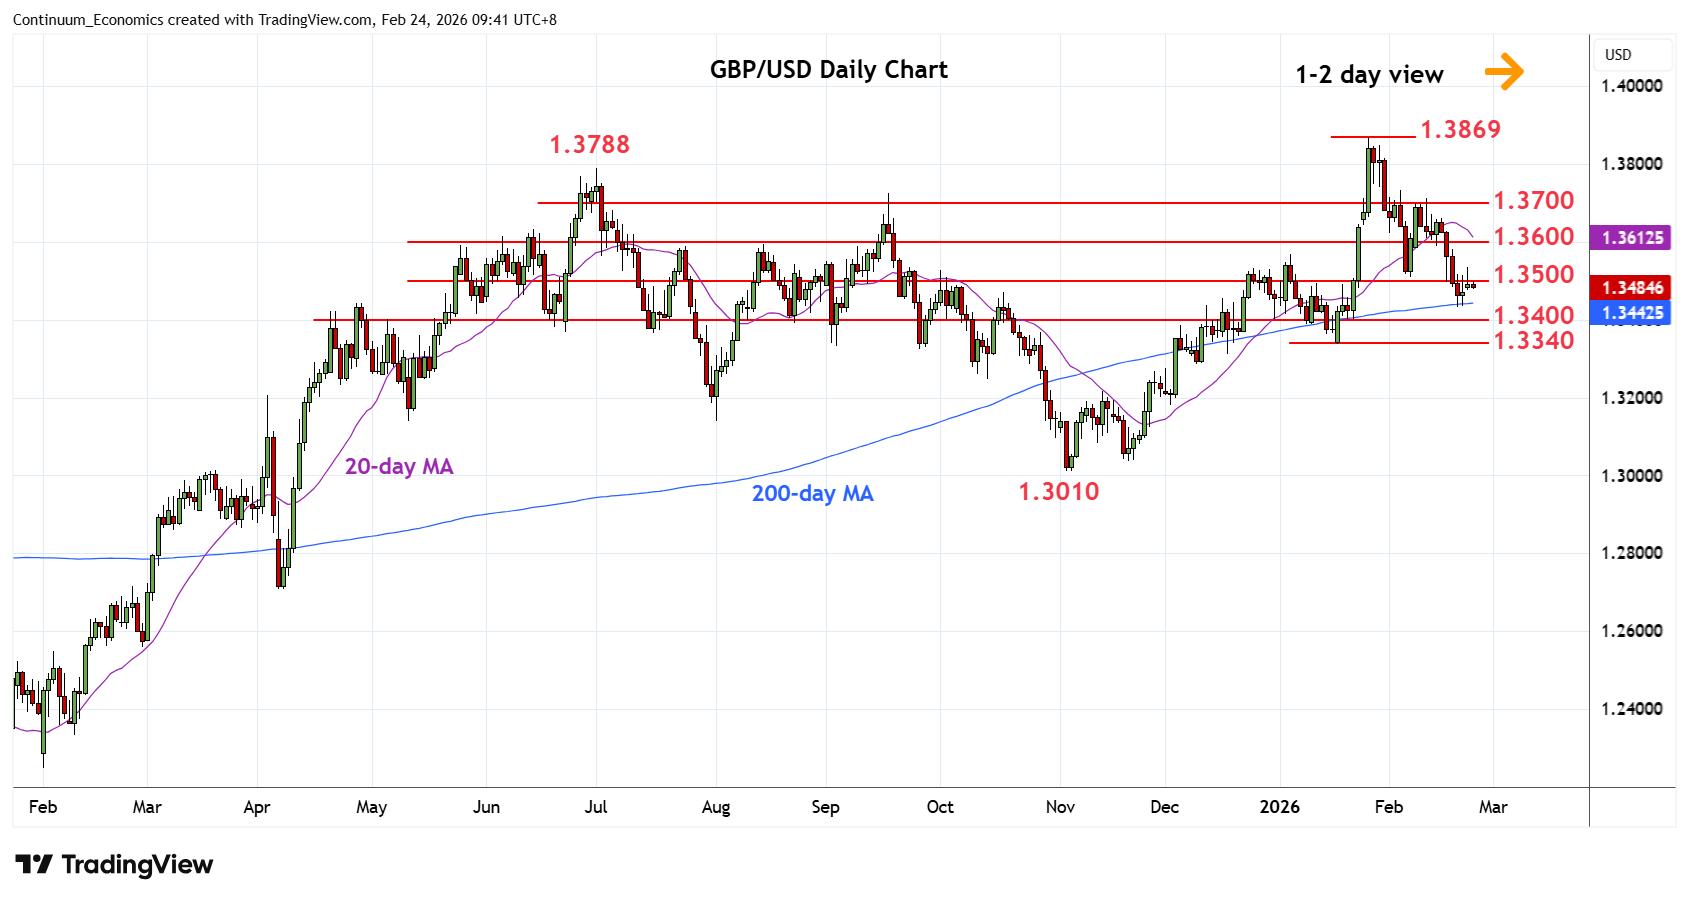
Higher in consolidation above the 1.3440 Fibonacci level and 200-day MA but gains remain limited above the 1.3500 level
| Level | Comment | Level | Comment | |||||
|---|---|---|---|---|---|---|---|---|
| R4 | 1.3788 | ** | Jul 2025 yr high | S1 | 1.3440 | * | 50% Nov/Jan rally | |
| R3 | 1.3700 | * | congestion | S2 | 1.3400 | * | congestion | |
| R2 | 1.3600/20 | ** | congestion | S3 | 1.3340 | ** | 19 Jan YTD low, 61.8% | |
| R1 | 1.3535 | * | 23 Feb high | S4 | 1.3300 | * | congestion |
Asterisk denotes strength of level
01:45 GMT - Higher in consolidation above the 1.3440 Fibonacci level and 200-day MA but gains remain limited above the 1.3500 level. Close above here will ease the downside pressure and open up room for stronger gains to retrace the 2-week losses from the 1.3700 level and see room to resistance at 1.3568 and 1.3600/50 congestion. Meanwhile, support at 1.3440 now underpin. Would take break here to extend the January losses and open up room to the 1.3400 level and the 1.3340, 19 January YTD low and 61.8% Fibonacci level.