Chart GBP/USD Update: Leaning lower

Little change, as deteriorating intraday studies keep near-term sentiment cautious
| Level | Comment | Level | Comment | |||||
|---|---|---|---|---|---|---|---|---|
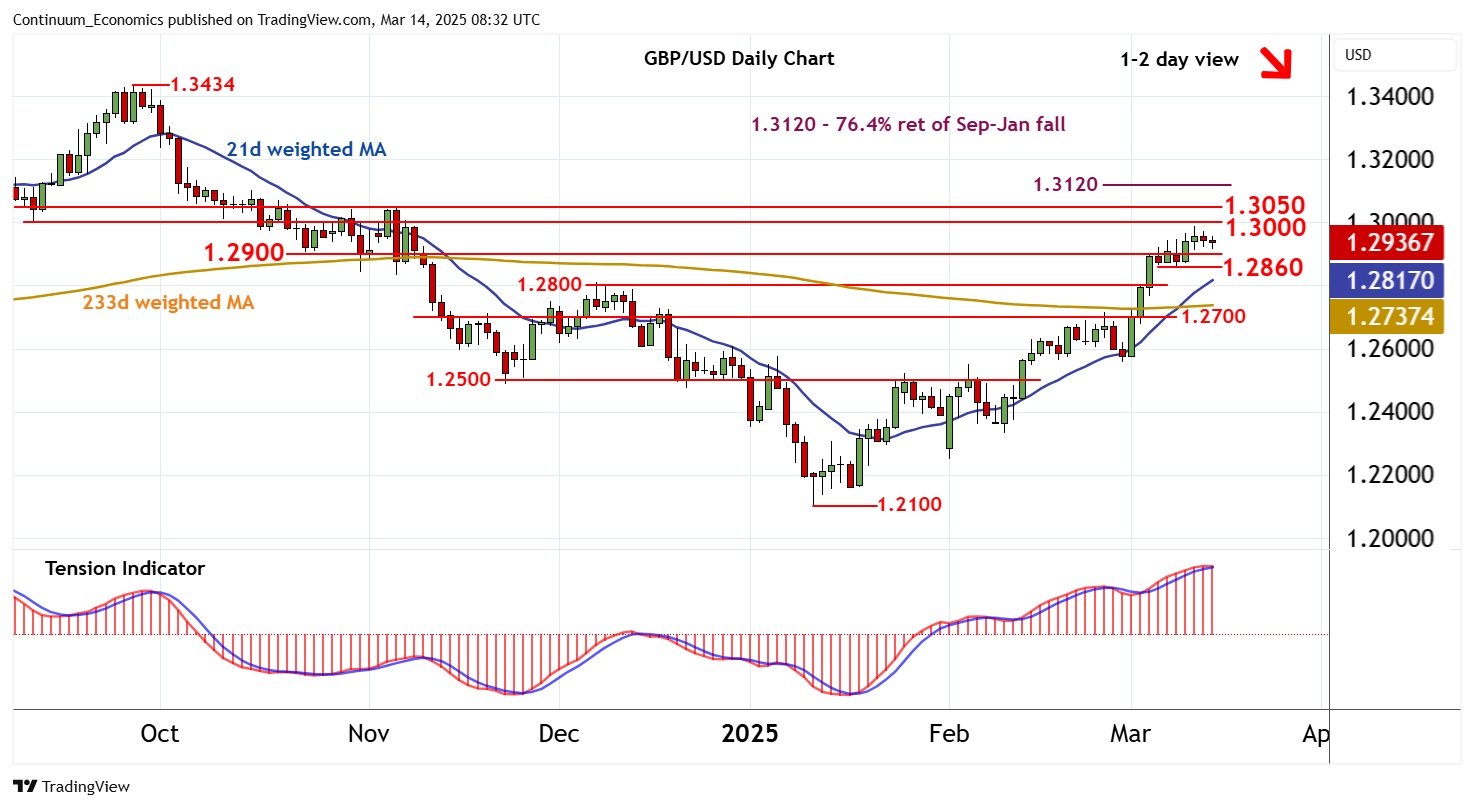
| R4 | 1.3100/20 | * | cong; 76.4% ret of Sep-Jan fall | S1 | 1.2900 | ** | congestion | |
| R3 | 1.3050 | * | break level | S2 | 1.2860 | * | recent lows | |
| R2 | 1.3000 | ** | break level | S3 | 1.2800 | ** | congestion | |
| R1 | 1.2988 | * | 12 Mar YTD high | S4 | 1.2700 | * | congestion |
Asterisk denotes strength of level
08:10 GMT - Little change, as deteriorating intraday studies keep near-term sentiment cautious and extend consolidation above congestion support at 1.2900. Daily stochastics are turning down in overbought areas and the flat daily Tension Indicator is turning down, suggesting increased selling interest and potential for a pullback. A break below 1.2900 will open up 1.2860. A further close beneath here will turn sentiment negative and open up a test of congestion around 1.2800. Meanwhile, resistance remains at the 1.2988 year high of 12 March and extends to 1.3000. A close above here is needed to turn price action positive and extend January gains towards 1.3050.