Published: 2025-08-26T11:39:22.000Z
Chart USD/ZAR Update: Consolidating above fresh 2025 year low
0
-
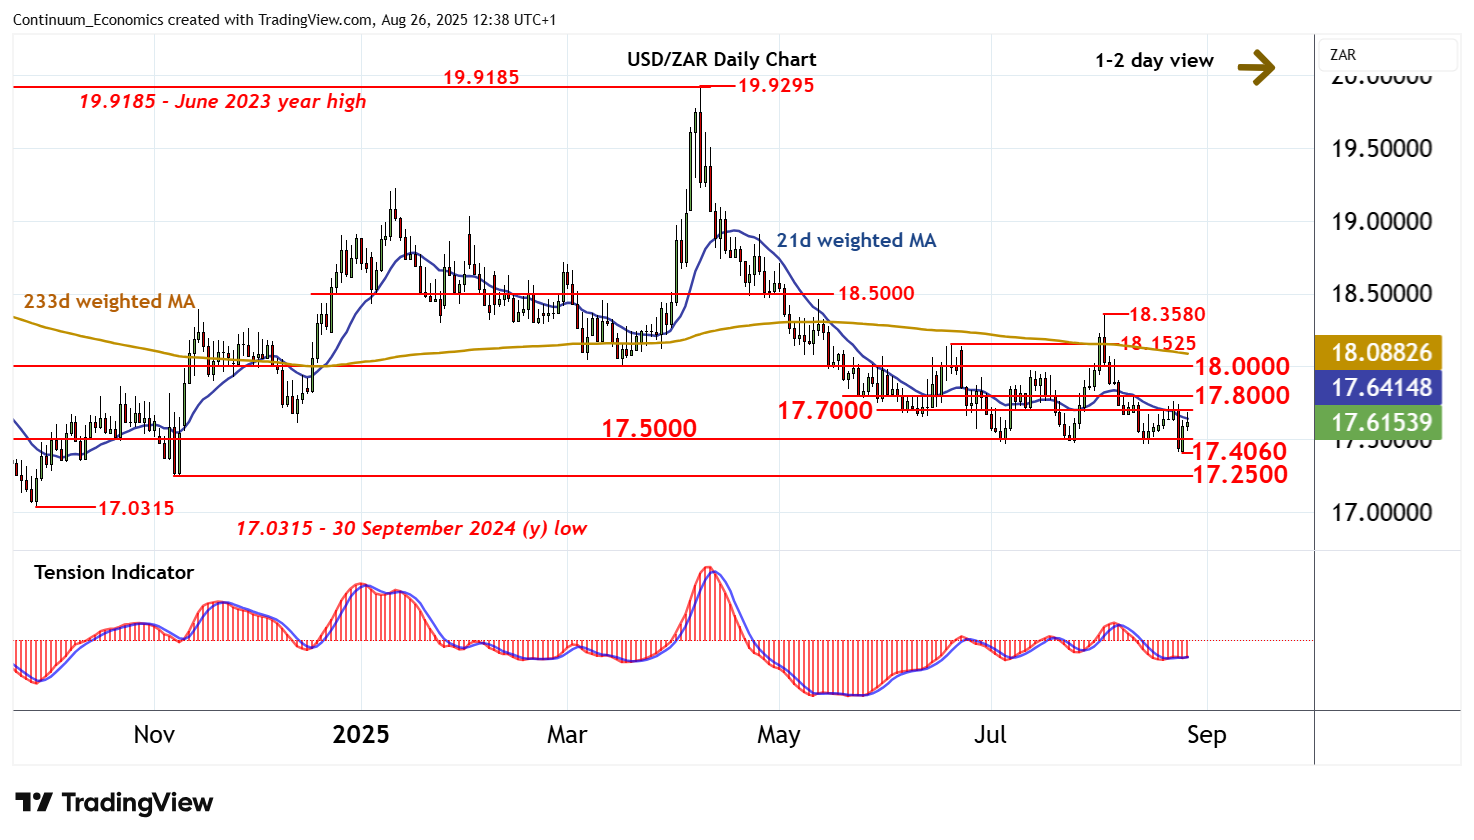
The anticipated break below 17.5000 has posted a fresh 2025 year low around 17.4060
| Level | Comment | Level | Comment | |||||
|---|---|---|---|---|---|---|---|---|
| R4 | 18.1525 | ** | 19 Jun (m) high | S1 | 17.5000 | ** | congestion | |
| R3 | 18.0000 | ** | congestion | S2 | 17.4060 | ** | 25 Aug YTD low | |
| R2 | 17.8000 | * | congestion | S3 | 17.2500 | ** | 7 Nov (m) low | |
| R1 | 17.7000 | * | congestion | S4 | 17.0315 | ** | 30 Sep 2024 (y) low |
Asterisk denotes strength of level
12:10 BST - The anticipated break below 17.5000 has posted a fresh 2025 year low around 17.4060, where rising intraday studies have prompted a steady bounce back above 17.5000. Immediate focus is on congestion resistance at 17.7000. But mixed daily readings and deteriorating weekly charts are expected to limit any break in renewed selling interest towards further congestion around 17.8000. Following cautious trade, fresh losses are looked for. A later break below 17.4060 will add weight to sentiment and confirm continuation of April losses, initially towards the 17.0315 year low of 30 September 2024.