Published: 2025-08-14T12:44:39.000Z
Chart USD/JPY Update: Leaning lower

Senior Technical Strategist
-
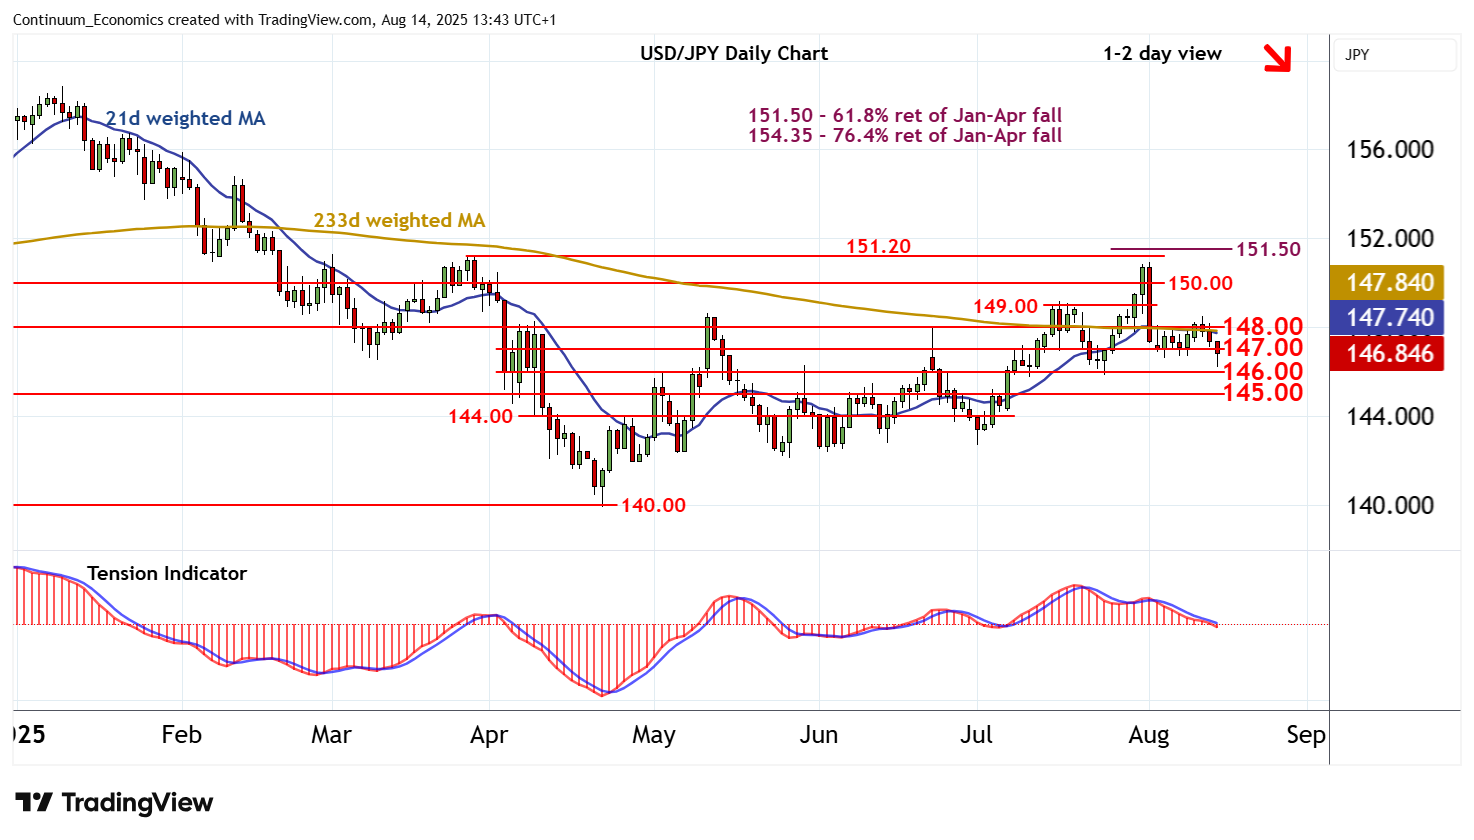
The anticipated break below 147.00 has reached 146.20~
| Levels | Imp | Comment | Levels | Imp | Comment | |||
|---|---|---|---|---|---|---|---|---|
| R4 | 149.00 | congestion | S1 | 146.00 | * | break level | ||
| R3 | 148.50~ | 12 Aug high | S2 | 145.00 | * | congestion | ||
| R2 | 148.00 | ** | break level | S3 | 144.00 | * | congestion | |
| R1 | 147.00 | congestion | S4 | 142.68 | * | 1 Jul (m) low |
Asterisk denotes strength of level
13:35 BST - The anticipated break below 147.00 has reached 146.20~, where a tick higher in oversold intraday studies is prompting a short-term bounce back towards congestion resistance at 147.00. Oversold daily stochastics are turning down and the daily Tension Indicator is under pressure, highlighting room for a further break beneath here and extension of August losses towards 145.00. However, mixed weekly charts are expected to limit any initial tests in fresh consolidation. Meanwhile, a close back above 147.00 will help to stabilise price action and prompt consolidation beneath resistance at 148.00.