Published: 2025-01-16T12:39:22.000Z
Chart USD/RUB Update: Consolidating - studies under pressure

Senior Technical Strategist
-

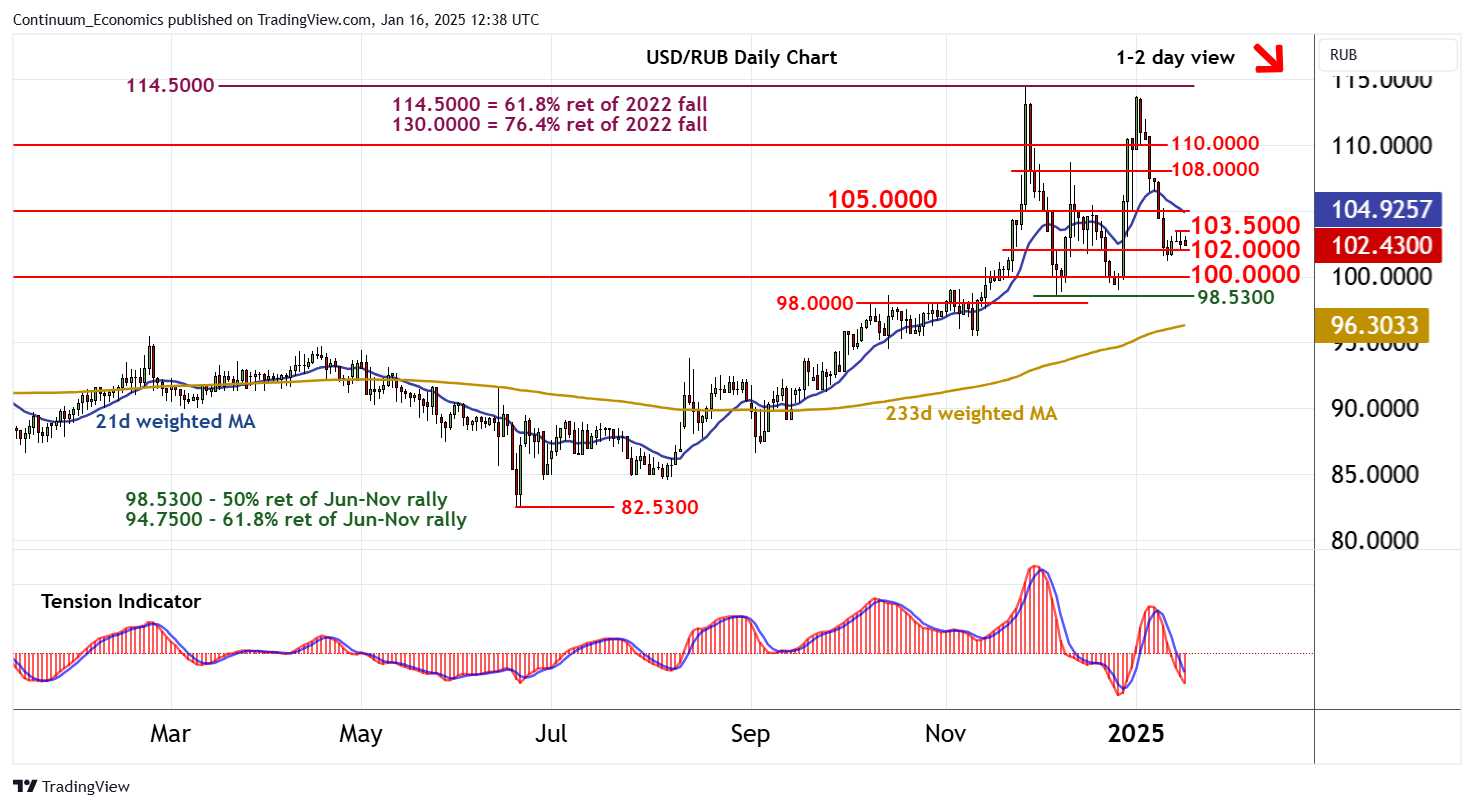
Little change, as prices extend consolidation beneath the 103.5000 high of 14 January

| Levels | Comment | Levels | Comment | |||||
| R4 | 110.0000 | ** | historic congestion | S1 | 102.0000 | * | recent range lows | |
| R3 | 108.0000 | * | break level | S2 | 100.0000 | ** | congestion | |
| R2 | 105.0000 | * | break level | S3 | 98.5300 | ** | 50% ret of Jun-Nov rally | |
| R1 | 103.5000 | 14 Jan high | S4 | 98.0000 | * | congestion |
Asterisk denotes strength of level
12:10 GMT - Little change, as prices extend consolidation beneath the 103.5000 high of 14 January. Daily readings have ticked lower once again and weekly charts are bearish, highlighting room for fresh losses in the coming sessions. Support remains at 102.0000. A close back beneath here will add weight to sentiment and extend January losses towards 100.0000. Still lower is the 98.5300 Fibonacci retracement, but by-then oversold weekly stochastics are expected to limit any initial tests in consolidation. Meanwhile, a break above 103.5000, if seen, should meet renewed selling interest towards 105.0000.