Published: 2026-04-02T08:28:19.000Z
Chart USD Index DXY Update: Choppy in range
1
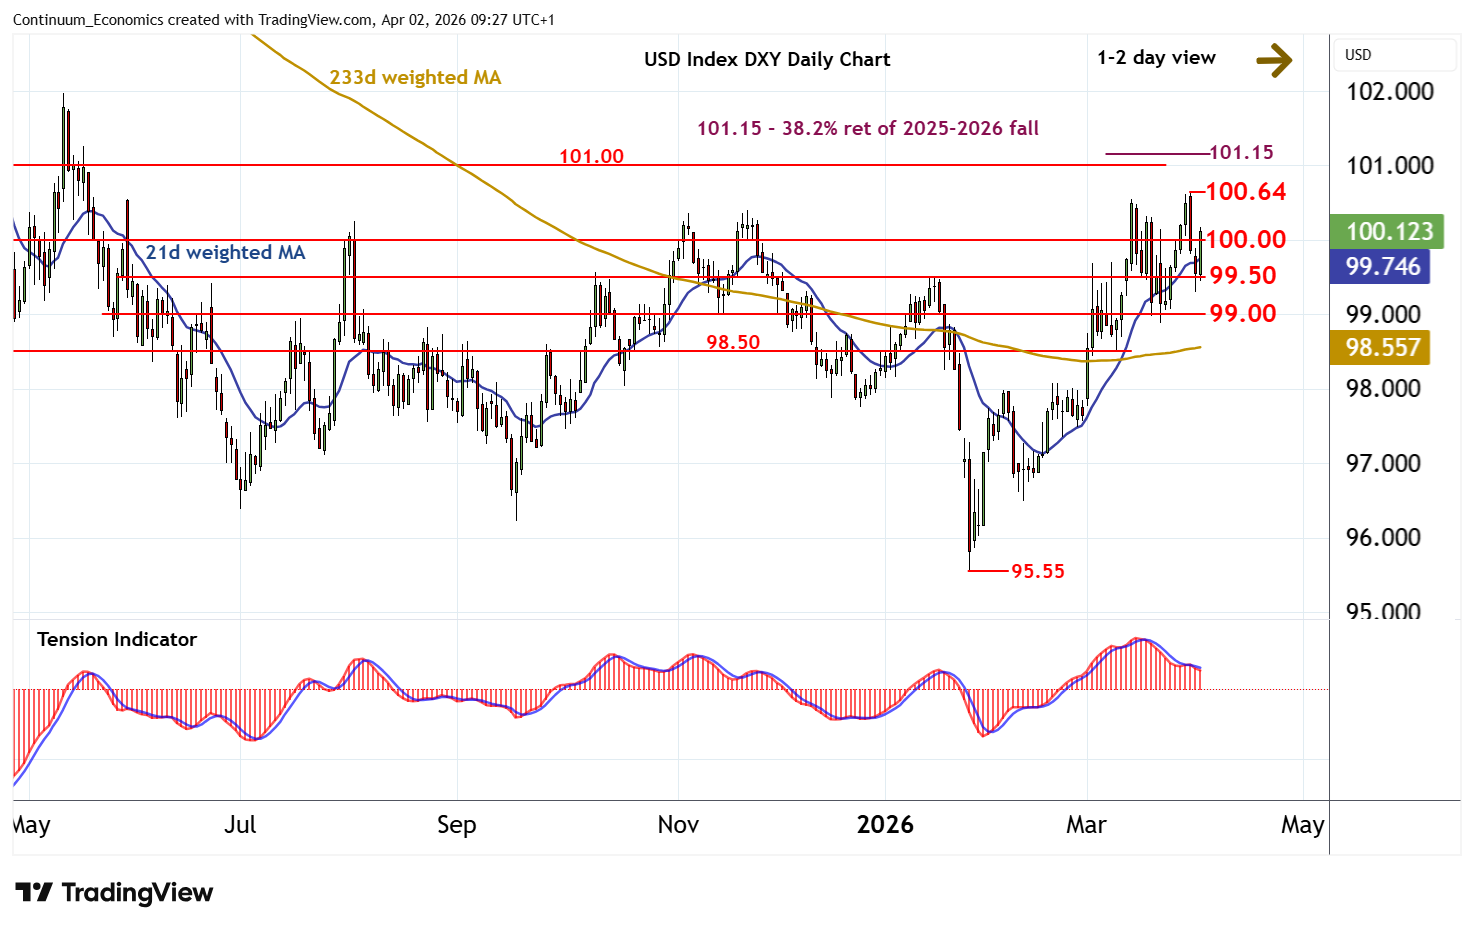
The break below congestion support at 99.50 has bounced smartly from 99.30
| Levels | Imp | Comment | Levels | Imp | Comment | |||
|---|---|---|---|---|---|---|---|---|
| R4 | 101.15 | ** | 38.2% ret of 2025-2026 fall | S1 | 99.50 | * | congestion | |
| R3 | 101.00 | * | congestion | S2 | 99.30 | 1 Apr low | ||
| R2 | 100.64 | ** | 31 Mar YTD high | S3 | 99.00 | ** | congestion | |
| R1 | 100.00 | ** | congestion | S4 | 98.88 | 23 Mar (w) low |
Asterisk denotes strength of level
09:10 BST - The break below congestion support at 99.50 has bounced smartly from 99.30, as oversold intraday studies unwind, with steady buying interest prompting a test of congestion resistance at 100.00. A break will open up the 100.64 current year high of 31 March. But negative daily readings and unwinding overbought weekly stochastics should prompt renewed selling interest beneath here. In the coming sessions, further cautious trade is looked for. A retest of 99.50 cannot be ruled out. But the rising weekly Tension Indicator and improving longer-term readings should limit any fresh break in renewed buying interest above 99.00.