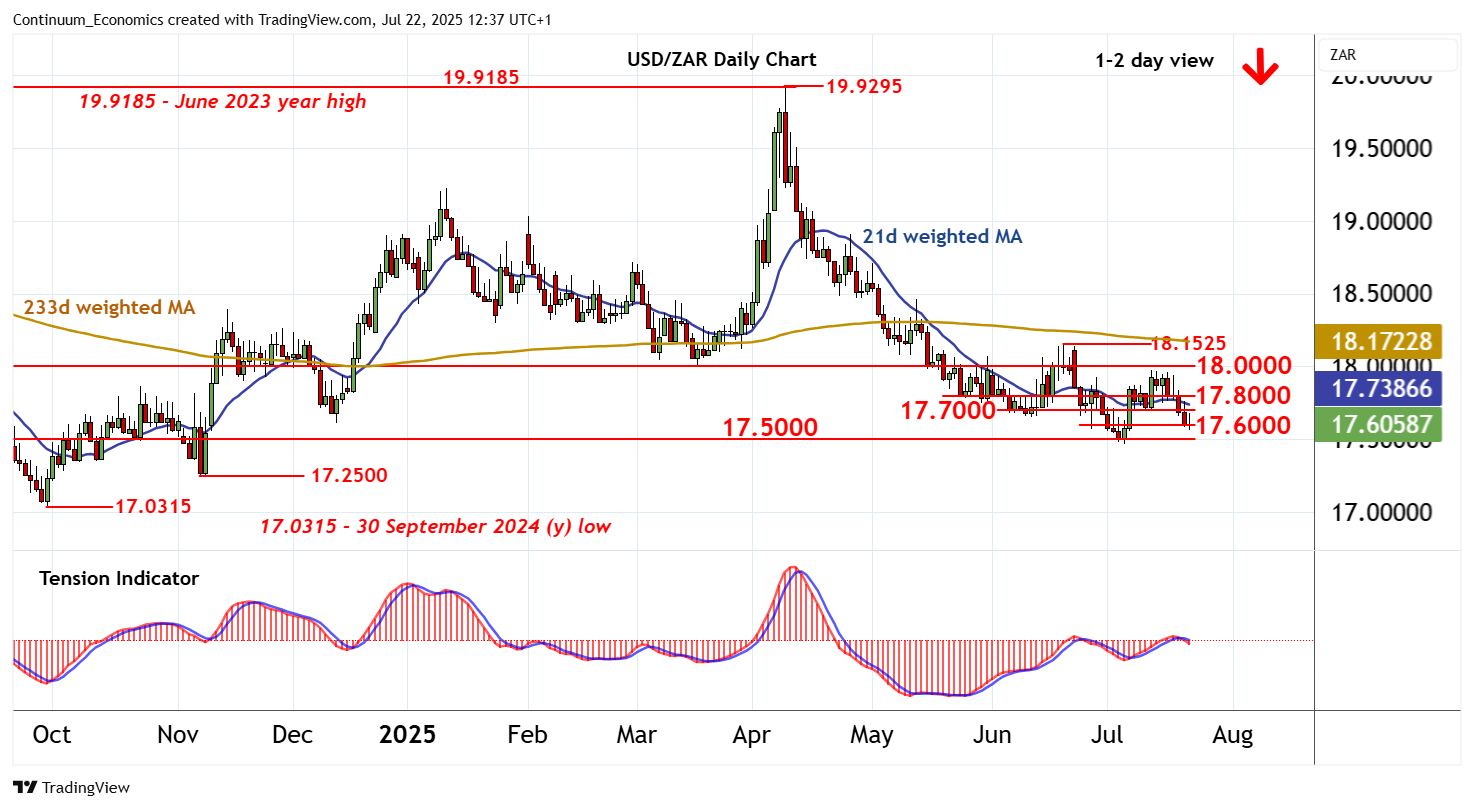
Chart USD/ZAR Update: Strong support at 17.5000

Anticipated losses have reached congestion support at 17.6000
| Level | Comment | Level | Comment | |||||
|---|---|---|---|---|---|---|---|---|
| R4 | 18.1525 | ** | 19 Jun (m) high | S1 | 17.6000 | * | congestion | |
| R3 | 18.0000 | ** | congestion | S2 | 17.5000 | ** | congestion | |
| R2 | 17.8000 | * | congestion | S3 | 17.2500 | ** | 7 Nov (m) low | |
| R1 | 17.8000 | * | congestion | S4 | 17.0315 | ** | 30 Sep 2024 (y) low |
Asterisk denotes strength of level
12:15 BST - Anticipated losses have reached congestion support at 17.6000, where unwinding oversold intraday studies are prompting short-term reactions. Daily stochastics and the daily Tension Indicator continue to track lower, highlighting room for continuation down to strong support at further congestion around 17.5000. But rising weekly stochastics could limit any initial tests in consolidation, before the bearish weekly Tension Indicator and negative longer-term charts prompt a break. A close below 17.5000 would add weight to sentiment and extend April losses towards 17.2500. Meanwhile, resistance is lowered to congestion around 17.7000 and extends to further congestion around 17.8000. A close above here would help to stabilise price action once again and prompt consolidation beneath 18.0000.