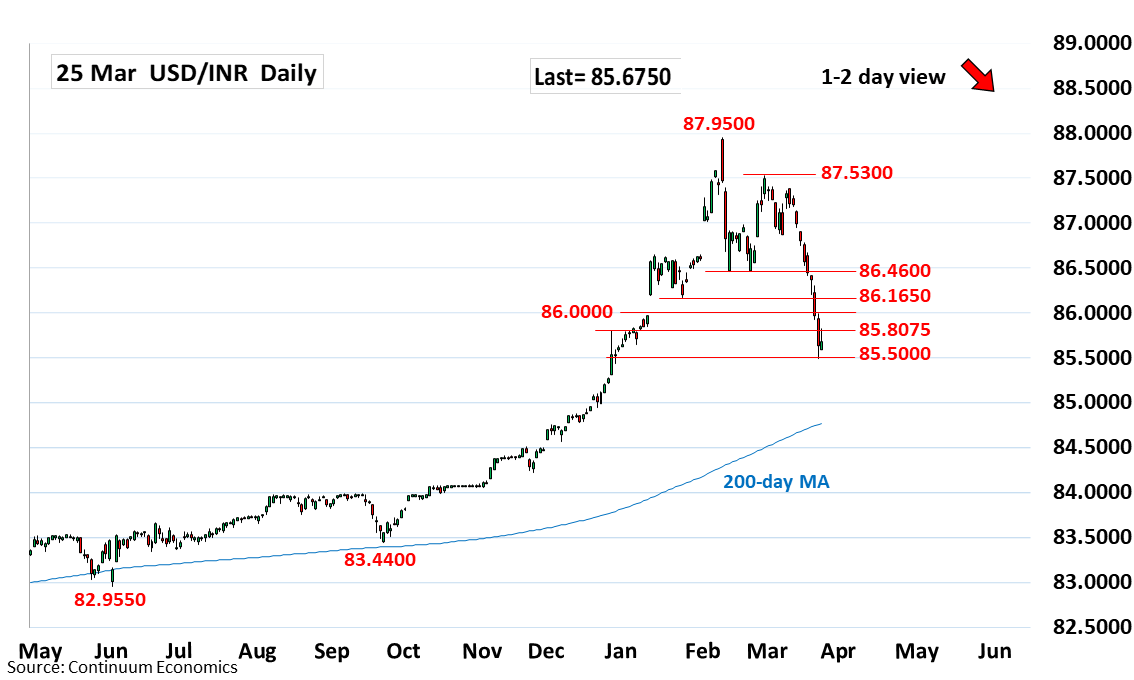
Break of the 86.0000 level has seen sharp losses through the 85.8075 support to reach 85.4900 low

| Level | Comment | Level | Comment | |||||
|---|---|---|---|---|---|---|---|---|
| R4 | 86.6525 | * | 31 Jan high | S1 | 85.4900 | * | 24 Mar low | |
| R3 | 86.4600 | ** | Feb low | S2 | 85.3100 | * | 27 Dec low | |
| R2 | 86.0000 | * | figure | S3 | 85.1900 | * | 61.8% Sep/Feb rally | |
| R1 | 85.8075 | * | 24 Jan low | S4 | 85.1000 | * | 20 Dec high |
Asterisk denotes strength of level
05:20 GMT - Break of the 86.0000 level has seen sharp losses through the 85.8075 support to reach 85.4900 low. Bounce from the latter see prices settling into consolidation above 85.5000 congestion and unwinding the oversold intraday studies. Daily studies are stretched as well and suggest scope for corrective bounce to resistance at the 85.8075 resistance and 86.0000 congestion. Gains above the latter, if seen, should meet see strong resistance at the February low at 86.4600 capping. Below the 85.4900 low will see room for extension to 85.3100 support and 85.1900, 61.8% Fibonacci level.