Published: 2026-01-23T14:39:51.000Z
Chart AUD/USD Update: Fresh 2026 year highs
8
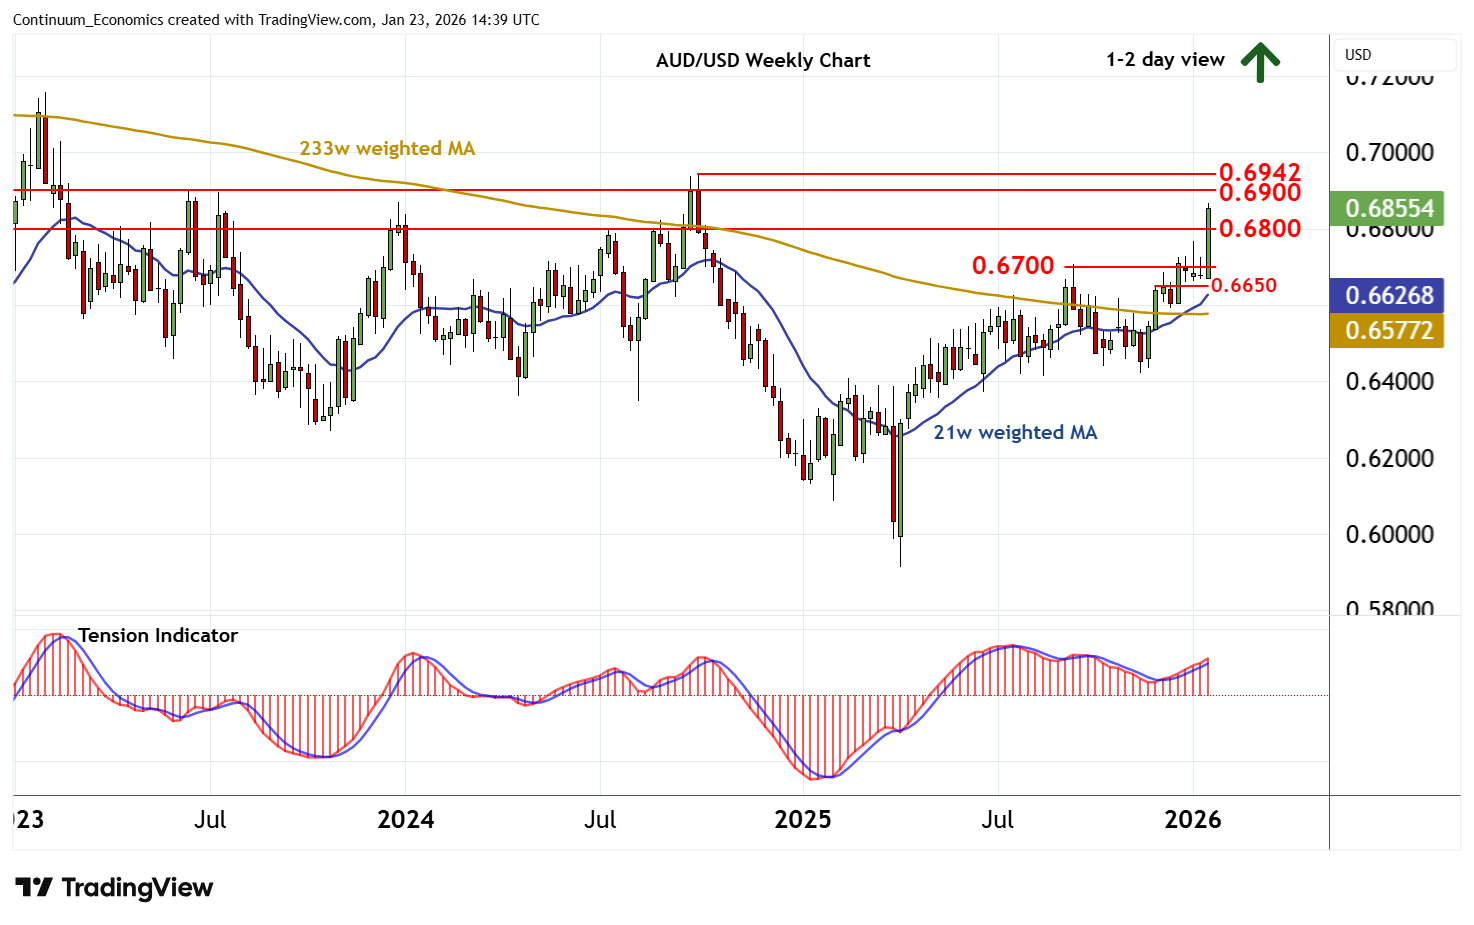
Little change, as prices extend April 2025 gains to post a fresh 2026 year high around 0.6865
| Levels | Imp | Comment | Levels | Imp | Comment | |||
|---|---|---|---|---|---|---|---|---|
| R4 | 0.7030 | * | mid-Feb 2023 (w) high | S1 | 0.6800 | ** | break level | |
| R3 | 0.7000 | ** | figure | S2 | 0.6700 | * | congestion | |
| R2 | 0.6942 | ** | September 2024 (y) high | S3 | 0.6650 | congestion | ||
| R1 | 0.6900 | * | break level | S4 | 0.6600 | ** | congestion |
Asterisk denotes strength of level
14:25 GMT - Little change, as prices extend April 2025 gains to post a fresh 2026 year high around 0.6865. Daily readings continue to rise and broader weekly charts are positive, highlighting room for a test of resistance at 0.6900. However, already overbought weekly stochastics are expected to limit any immediate break beyond here in profit-taking/consolidation beneath critical resistance at the 0.6942 year high of September 2024. Meanwhile, support is raised to 0.6800 and should underpin any immediate setbacks.