Chart USD Index DXY Update: Choppy trade
Sharp losses from the 98.83 weekly high of 22 August have bounced from congestion support at 97.50
| Levels | Imp | Comment | Levels | Imp | Comment | |||
|---|---|---|---|---|---|---|---|---|
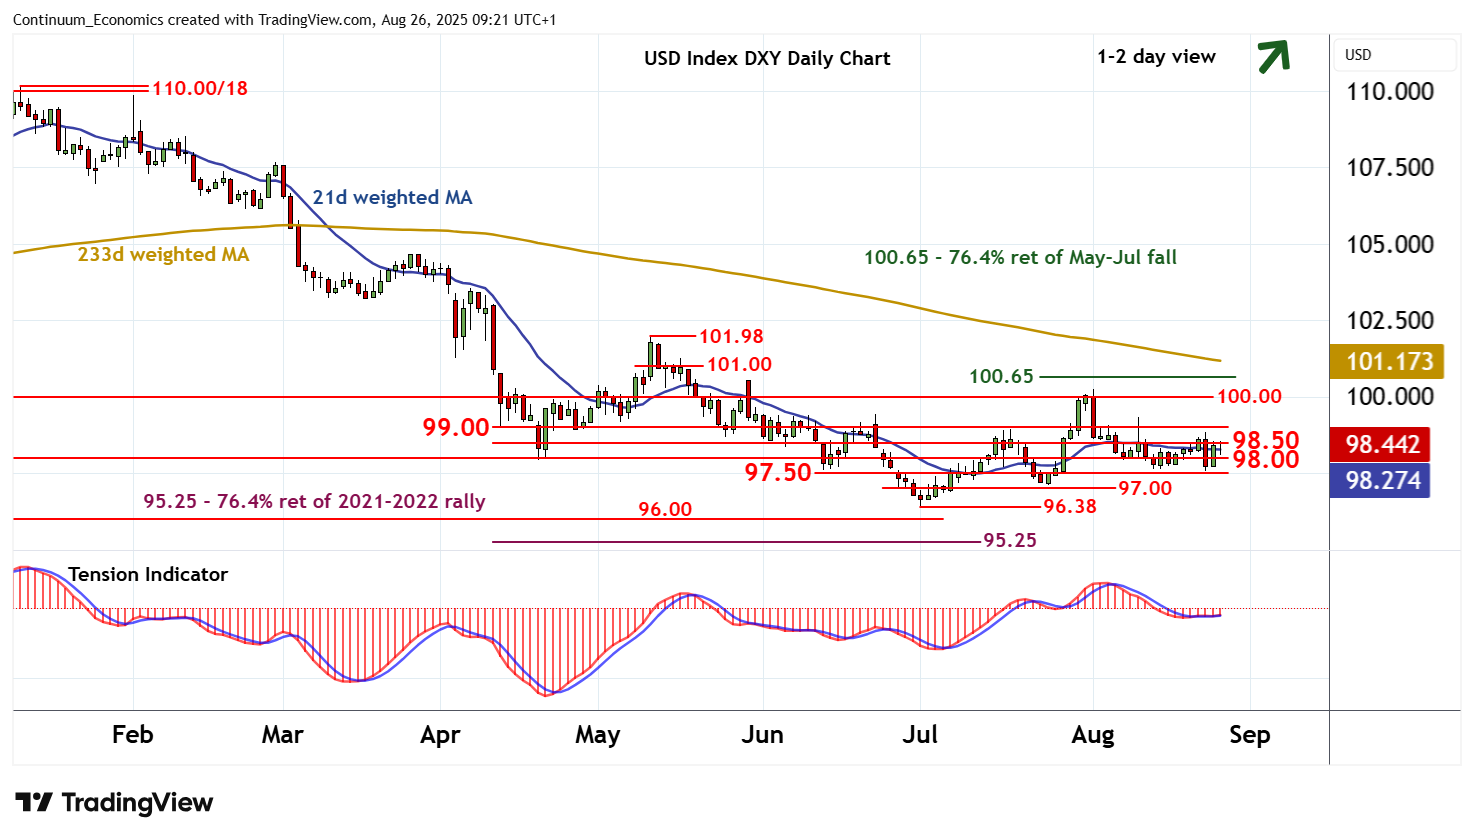
| R4 | 100.65 | ** | 76.4% ret of May-Jul fall | S1 | 98.00 | * | congestion | |
| R3 | 100.00 | ** | congestion | S2 | 97.50 | * | congestion | |
| R2 | 99.00 | * | break level | S3 | 97.00 | * | congestion | |
| R1 | 98.50 | congestion | S4 | 96.38 | ** | 1 Jul YTD low |
Asterisk denotes strength of level
09:10 BST - Sharp losses from the 98.83 weekly high of 22 August have bounced from congestion support at 97.50, with prices currently pressuring congestion resistance at 98.50. Daily studies are mixed, highlighting a cautious tone and room for further consolidation into the coming sessions. However, broader weekly charts are mixed/positive, pointing to room for a later break above 98.50 towards 99.00. A further break above here will improve sentiment and open up 100.00. But mixed longer-term readings should limit any initial tests in consolidation. Meanwhile, support is at congestion around 98.00 and extends to 97.50. This range should underpin any immediate setbacks.