Published: 2026-03-23T01:41:28.000Z
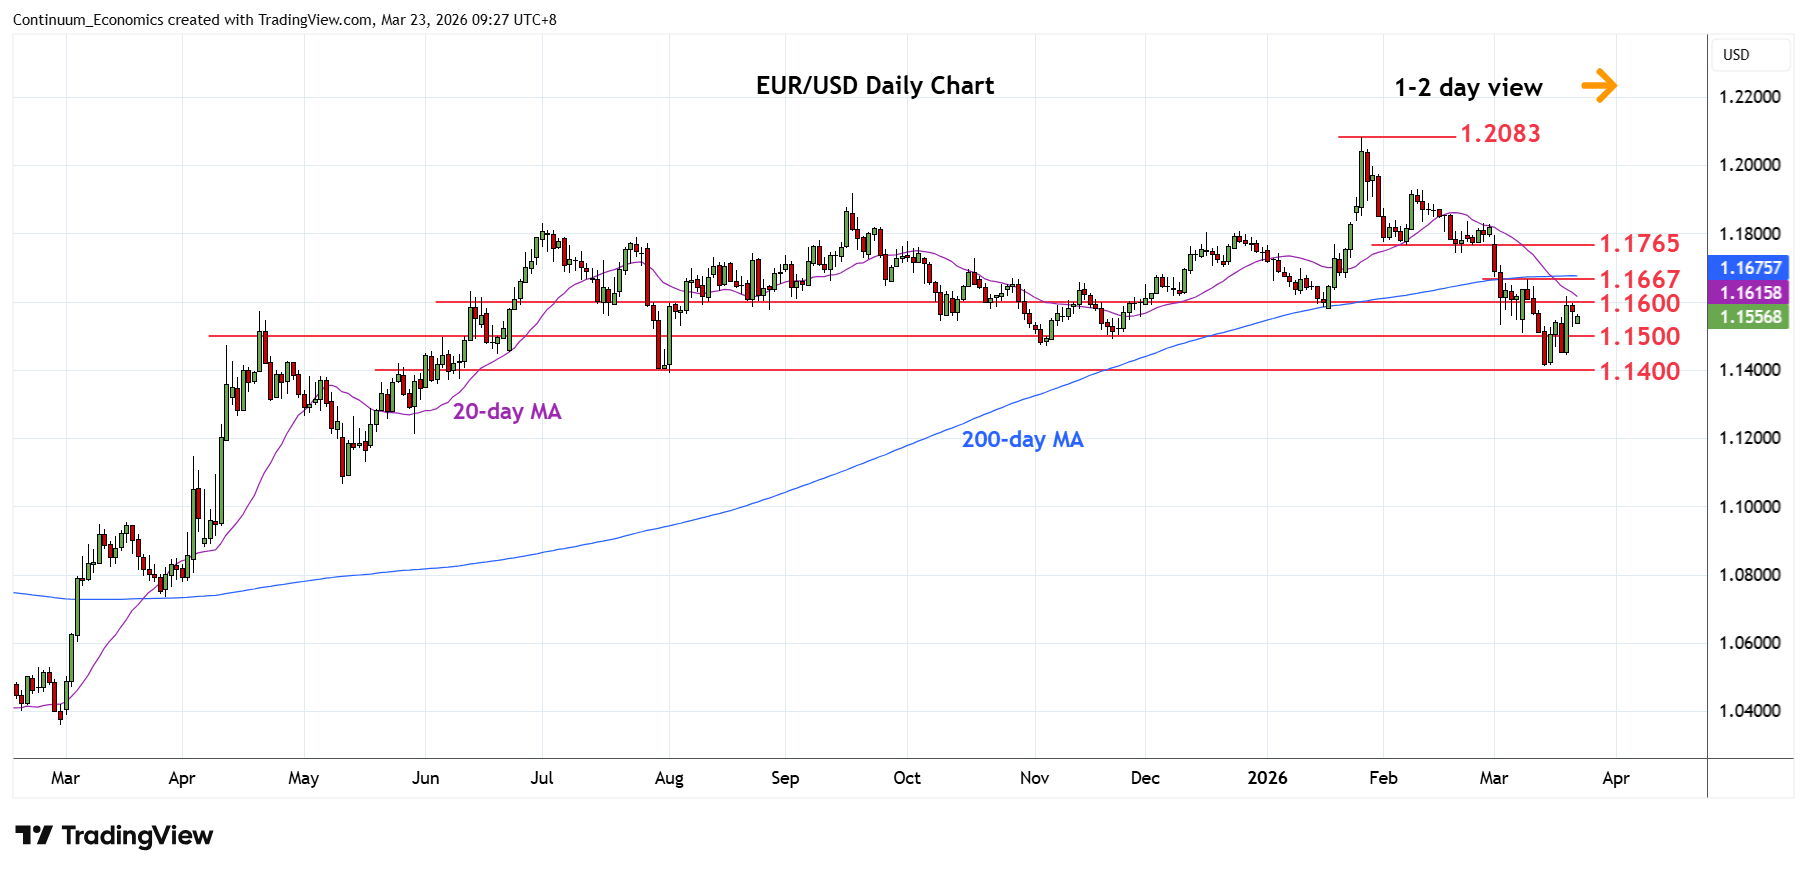
Chart EUR/USD Update: Lower in consolidation below 1.1600
-
Lower in consolidation from the 1.1616 high of last week but further gains cannot be ruled out in choppy trade from the 1.1410 low
| Levels | Imp | Comment | Levels | Imp | Comment | |||
|---|---|---|---|---|---|---|---|---|
| R4 | 1.1742/65 | ** | 19, 6 Feb lows | S1 | 1.1500 | * | congestion | |
| 14 | 1.1700 | * | congestion | S2 | 1.1443 | * | 19 Mar low | |
| R2 | 1.1667 | ** | 10 Mar high | S3 | 1.1410 | ** | 13 Mar YTD low | |
| R1 | 1.1600 | * | congestion | S4 | 1.1355 | * | 38.2% 2025/Jan rally |
Asterisk denotes strength of level
01:35 GMT - Lower in consolidation from the 1.1616 high of last week but further gains cannot be ruled out in choppy trade from the 1.1410, 13 March current year low. Daily studies are unwinding oversold readings and break above the 1.1600 level will open up room for retest of the 1.1667 resistance. Meanwhile, support is raised to the 1.1500 congestion which should underpin. Break here will return focus to the downside for retest of the 1.1443 and 1.1410 lows. Below these will extend the January losses and see room for extension to 1.1355, 38.2% Fibonacci level.