Published: 2026-04-14T12:00:32.000Z
Chart USD/ZAR Update: Recent gains not sustained - studies under pressure
-
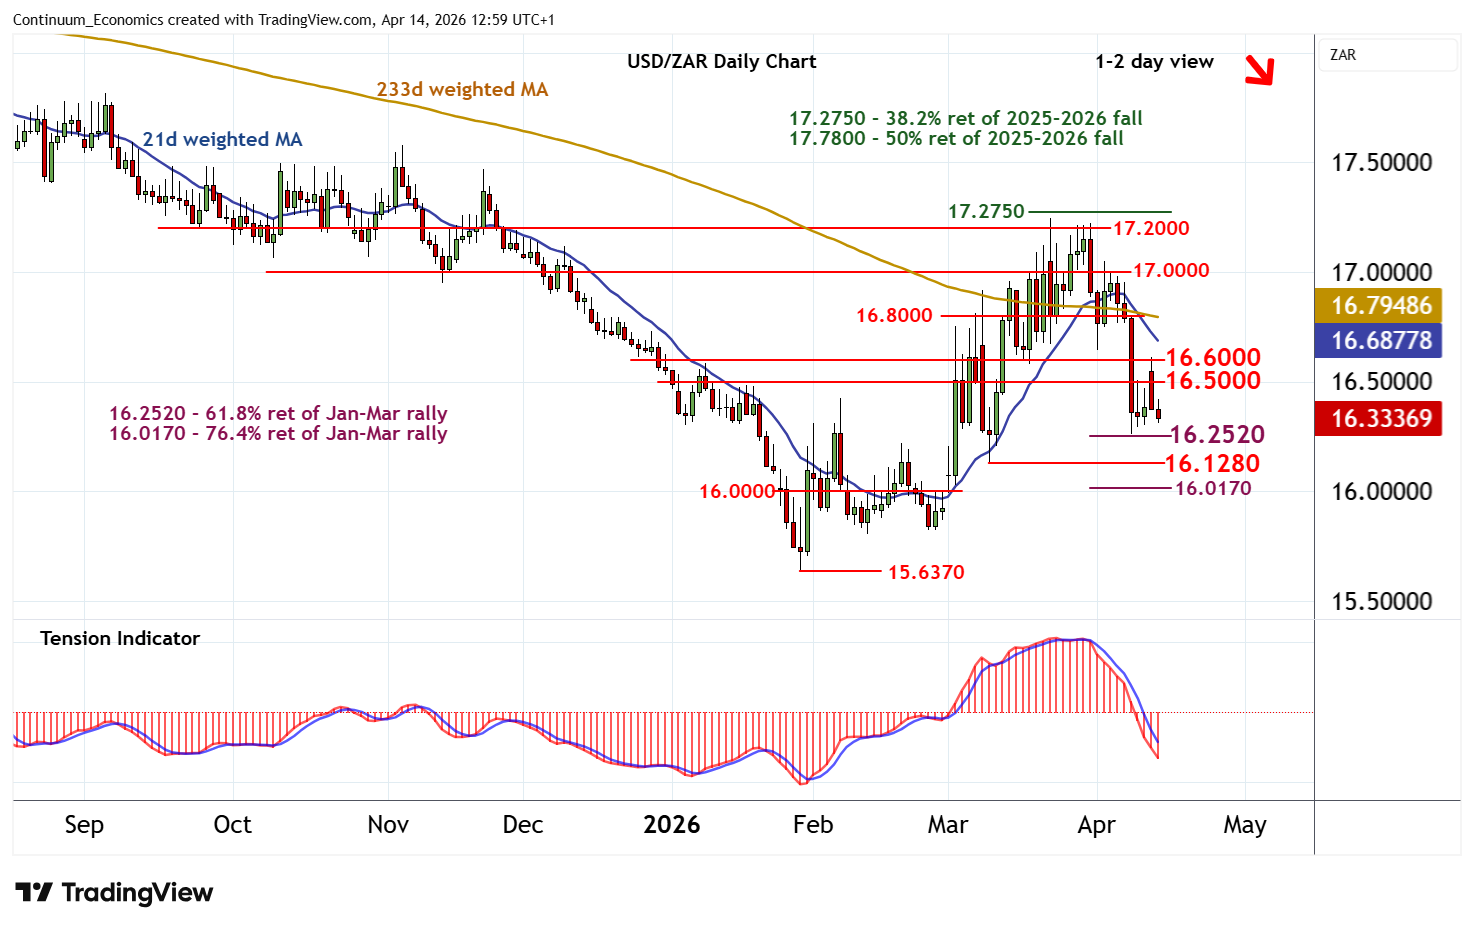
The move into the 16.5000 - 16.6000 resistance has given way to a sharp pullback
| Level | Comment | Level | Comment | |||||
|---|---|---|---|---|---|---|---|---|
| R4 | 17.0000 | * | congestion | S1 | 16.2520 | ** | 61.8% ret of Jan-Mar rally | |
| R3 | 16.8000 | * | congestion | S2 | 16.1280 | * | 10 Mar (w) low | |
| R2 | 16.6000 | break level | S3 | 16.0170 | ** | 76.4% ret of Jan-Mar rally | ||
| R1 | 16.5000 | break level | S4 | 16.0000 | ** | congestion |
Asterisk denotes strength of level
12:15 BST - The move into the 16.5000 - 16.6000 resistance has given way to a sharp pullback, with prices currently trading around 16.3550. Oversold daily stochastics are flat, suggesting potential for further consolidation around here, before the bearish daily Tension Indicator and negative weekly charts prompt further losses. A close below support at the 16.2520 Fibonacci retracement will add weight to sentiment and extend late-March losses towards the 16.1280 weekly low of 10 March. Meanwhile, a close above 16.6000, if seen, will help to stabilise price action and prompt consolidation beneath congestion around 16.8000.