Chart USD/ZAR Update: Extending pressure on critical support
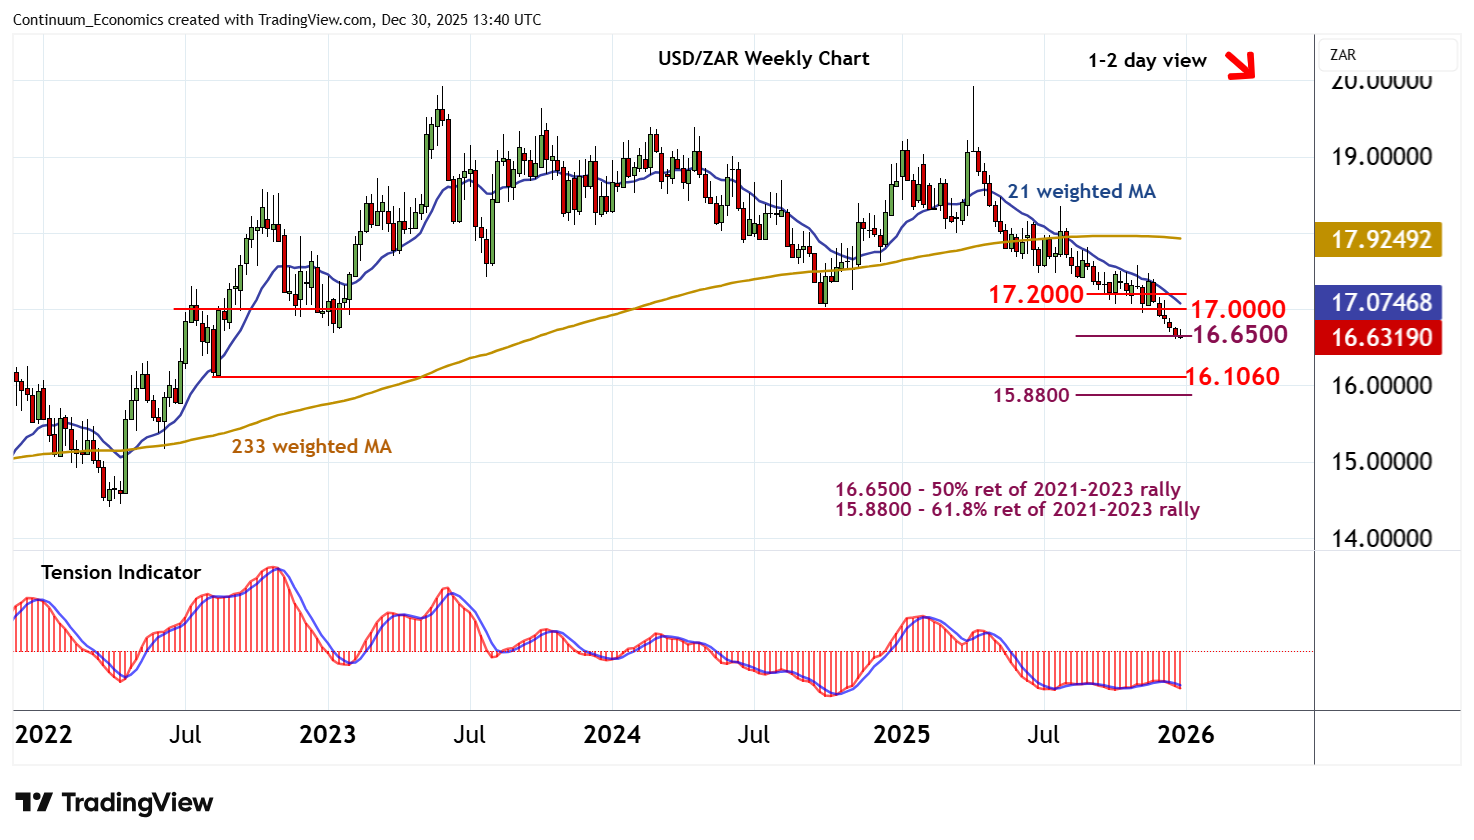
Little change, as prices extend consolidation within critical support at the 2025 year low around 16.6100 and the 16.6500 Fibonacci retracement
| Level | Comment | Level | Comment | |||||
|---|---|---|---|---|---|---|---|---|
| R4 | 17.4000 | * | congestion | S1 | 16.6500 | ** | 50% ret of 2021-2023 rally | |
| R3 | 17.2000 | * | congestion | S2 | 16.6100 | ** | 24 Dec YTD low | |
| R2 | 17.0000 | ** | congestion | S3 | 16.1060 | ** | August 2022 low | |
| R1 | 16.8000 | break level | S4 | 15.8800 | ** | 61.8% ret of 2021-2023 rally |
Asterisk denotes strength of level
13:20 GMT - Little change, as prices extend consolidation within critical support at the 2025 year low around 16.6100 and the 16.6500 Fibonacci retracement. Negative daily studies are flat, suggesting potential for further sideways trade. But broader weekly charts and longer-term readings are mixed/negative, highlighting room for still deeper losses in the coming sessions. A close below 16.6100 - 16.6500 will add weight to sentiment and extend April losses towards the 16.1060 low of August 2022. Meanwhile, resistance remains at the 16.8000 break level and extends to congestion around 17.0000. This range should cap any immediate tests higher.