Published: 2024-12-11T02:00:56.000Z
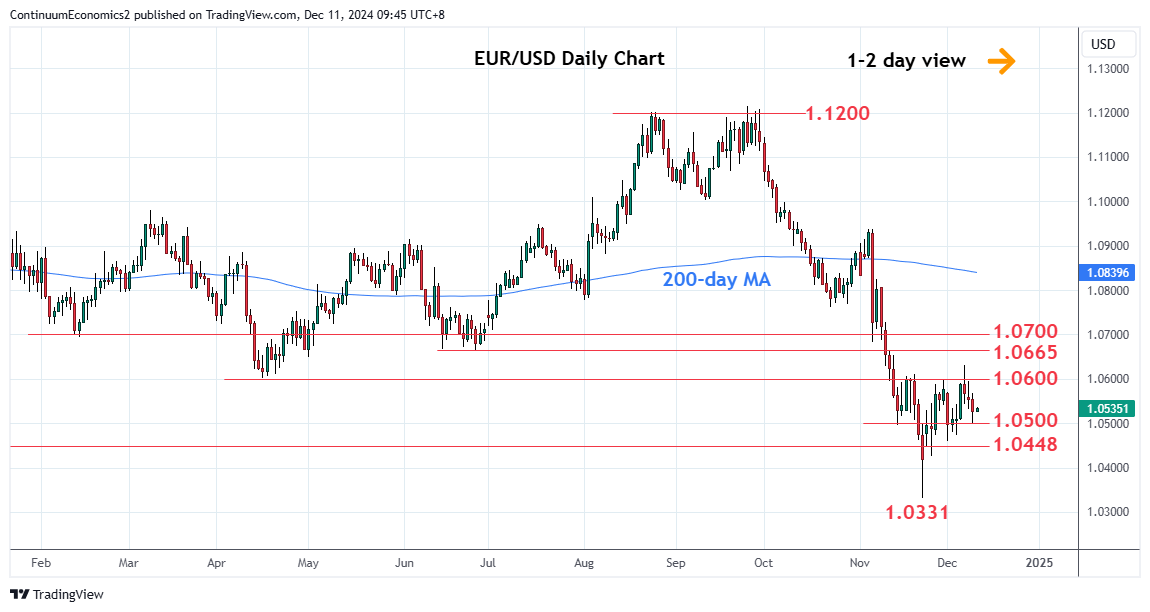
Chart EUR/USD Update: Lower in consolidation

Technical Analyst
-
Lower in consolidation following rejection from the 1.0600/10 resistance to reach the 1.0500 level

| Levels | Imp | Comment | Levels | Imp | Comment | |||
|---|---|---|---|---|---|---|---|---|
| R4 | 1.0761/75 | * | Oct low, 50% | S1 | 1.0500 | * | congestion | |
| R3 | 1.0700 | * | Feb low | S2 | 1.0448 | * | 2023 year low | |
| R2 | 1.0665/70 | * | Jun low, 38.2% | S3 | 1.0425/00 | * | 26 Nov low, figure | |
| R1 | 1.0600/10 | ** | Apr low, congestion | S4 | 1.0331 | ** | 22 Nov YTD low |
Asterisk denotes strength of level
01:50 GMT - Lower in consolidation following rejection from the 1.0600/10 resistance to reach the 1.0500 level. Below this will see room for deeper pullback to strong support at the 1.0448 2023 year low and the 1.0400 level. However, consolidation expected to give way to renewed buying pressure later and higher low sought to extend choppy recovery from 1.0331 November low. Break above the 1.0600/10 resistance will see room to extend gains and retrace losses from the September high. Clearance will see room to the 1.0665/70 resistance and 38.2% Fibonacci retracement then the 1.0700 level.