Chart USD/ZAR Update: Gains capped in range
The anticipated test below congestion support at 16.8000 has bounced from just above the 16.6000 - 16.6350 range
| Level | Comment | Level | Comment | |||||
|---|---|---|---|---|---|---|---|---|
| R4 | 17.5000 | ** | break level | S1 | 16.8000 | congestion | ||
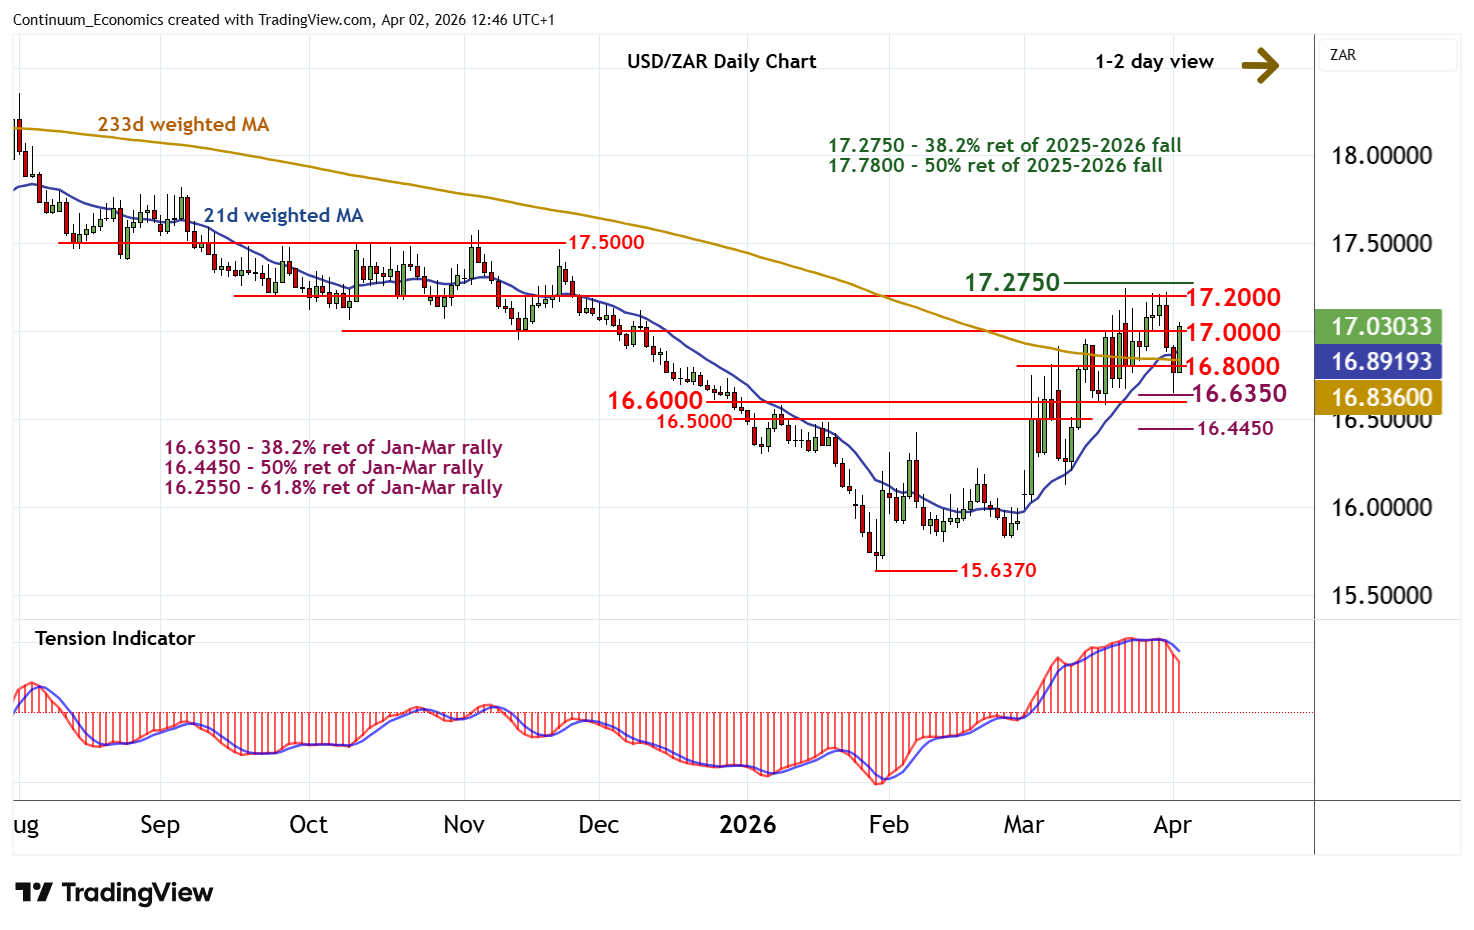
| R3 | 17.2750 | ** | 38.2% ret of 2025-2026 fall | S2 | 16.6350 | 38.2% ret of Jan-Mar rally | ||
| R2 | 17.2000 | * | congestion highs | S3 | 16.6000 | break level | ||
| R1 | 17.0000 | * | congestion | S4 | 16.5000 | break level |
Asterisk denotes strength of level
12:35 BST - The anticipated test below congestion support at 16.8000 has bounced from just above the 16.6000 - 16.6350 range, as intraday studies turn higher, with steady gains currently pressuring congestion resistance at 17.0000. Daily readings continue to track lower, however, and weekly stochastics are flat in overbought areas, suggesting immediate gains could be limited in renewed selling interest/consolidation beneath resistance at the 17.2000 congestion highs. The positive weekly Tension Indicator and improving longer-term charts see potential for a later break above here and continuation of January gains beyond the 17.2750 Fibonacci retracement. Meanwhile, a close below the 16.6350 Fibonacci retracement, if seen, would turn sentiment negative and extend late-March losses below 16.6000 towards the 16.4450 retracement.