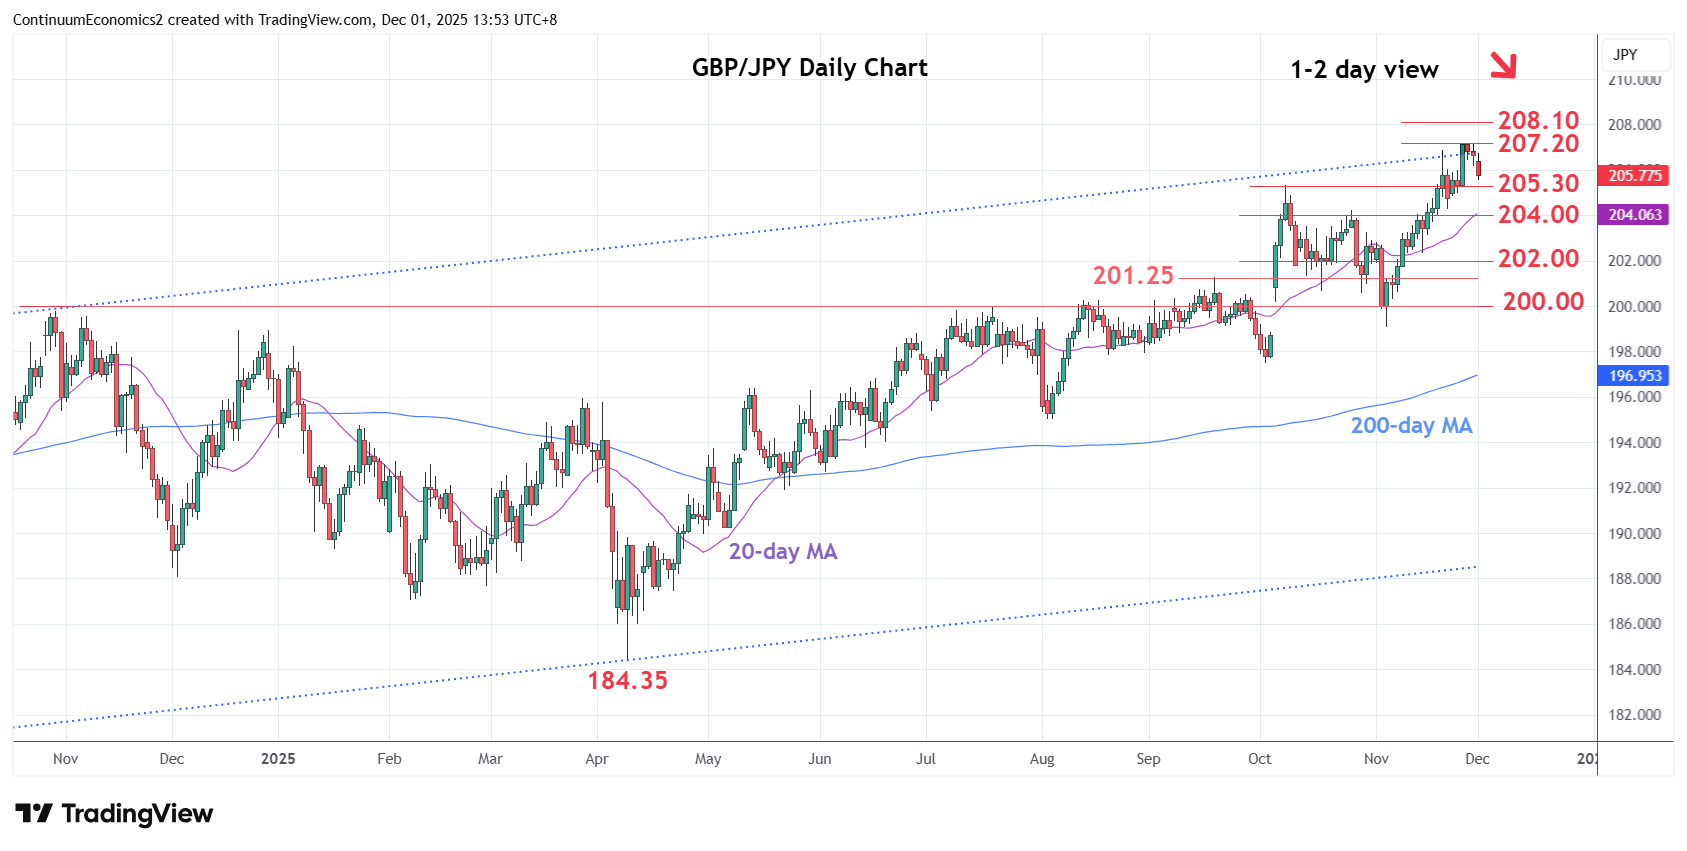
Chart GBP/JPY Update: Leaning lower from 207.20, November YTD high
Settling back from the 207.20 November current year high as prices unwind overbought intraday and daily studies
| Levels | Imp | Comment | Levels | Imp | Comment | |||
|---|---|---|---|---|---|---|---|---|
| R4 | 212.00 | * | congestion | S1 | 205.30 | * | Oct high | |
| R3 | 210.00 | * | congestion | S2 | 204.00 | * | congestion | |
| R2 | 208.10 | ** | Jul 2024 multi-year high | S3 | 202.30/00 | * | 11 Nov low, congestion | |
| R1 | 207.20 | * | 26 Nov YTD high | S4 | 201.25 | ** | Sep high |
Asterisk denotes strength of level
06:00 GMT - Settling back from the 207.20 November current year high as prices unwind overbought intraday and daily studies. Weekly chart are stretched as well and caution corrective pullback to retrace strong gains from the 184.35, April current year low. Break of the 206.00 level see room to support at the 205.30 October high and extending to 204.00 congestion. This area should underpin and only break here will fade the upside pressure and see room for deeper pullback to the 202.00/201.25 support. Above the 207.20 high, if seen, will open up room for extension to retest the 208.10, July 2024 multi-year high.