Chart AUD/USD Update: Under pressure
Anticipated losses have tested below 0.7065 to reach 0.7045~
| Levels | Imp | Comment | Levels | Imp | Comment | |||
|---|---|---|---|---|---|---|---|---|
| R4 | 0.7280~ | ** | June 2022 high | S1 | 0.7065 | * | 10-11 Feb lows | |
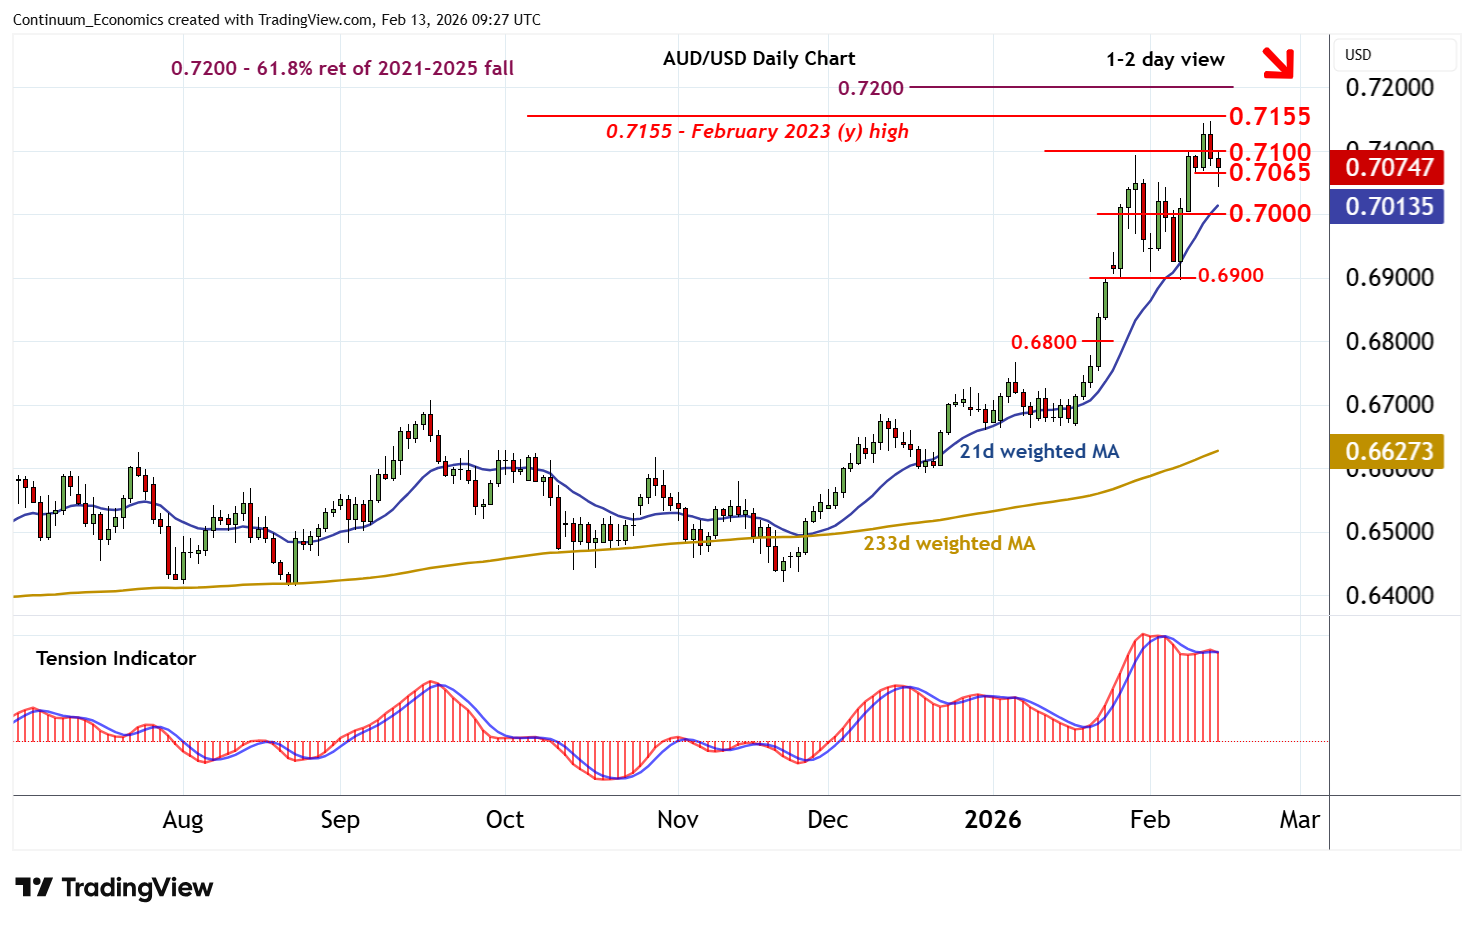
| R3 | 0.7200 | ** | 61.8% ret of 2021-2025 fall | S2 | 0.7000 | * | congestion | |
| R2 | 0.7147/55~ | ** | 12 Feb YTD high; Feb 2023 (y) high | S3 | 0.6900 | ** | break level | |
| R1 | 0.7100 | break level | S4 | 0.6800 | break level |
Asterisk denotes strength of level
09:20 GMT - Anticipated losses have tested below 0.7065 to reach 0.7045~, before bouncing back into consolidation around 0.7075. Daily stochastics have turned down and the flat daily Tension Indicator is also coming under pressure, highlighting a deterioration in sentiment and room for deeper losses in the coming sessions. A close below the 0.7065 lows from 10-11 February will add weight to sentiment and open up congestion around 0.7000. Meanwhile, a close back above 0.7100 would help to stabilise price action. But a further close above the 0.7147 current year high of 12 February and the 0.7155~ year high of February 2023 is needed to turn sentiment positive and open up strong resistance at the 0.7200 Fibonacci retracement.