Continuum Economics
  • Search
  • About Us
  • Buy
  • Invite A Friend
  • My Basket
  • Articles
  • Calendar
  • Forecasts
  • Events
  • Data
  • Newsletters
  • My Alerts
  • Community
  • Directory
  • About Us
  • Buy
  • Invite A Friend
  • My Basket
  • Articles
    • All
    • Thematic
    • Tactical
    • Asia
    • EMEA
    • Americas
    • Newsletters
    • Freemium
    • Editor's Choice
    • Most Viewed
    • Most Shared
    • Most Liked
  • Calendar
    • Interactive
      • China
      • United States
      • Eurozone
      • United Kingdom
    • Month Ahead
    • Reviews
    • Previews
  • Forecasts
    • Forecasts
    • Key Views
  • Events
    • Media
    • Conference Calls
  • Data
    • Country Insights
    • Shadow Credit Ratings
    • Full CI Data Download
  • Newsletters
  • My Alerts
  • Community
    • FX
    • Fixed Income
    • Macro Strategy
    • Credit Markets
    • Equities
    • Commodities
    • Precious Metals
    • Renewables
  • Directory
  • My Account
  • Notifications Setup
  • Administration Panel
  • Account Details
  • Recent Devices
  • Distribution Lists
  • Shared Free Trials
  • Saved Articles
  • Shared Alerts
  • My Posts
Back
Published: 2026-03-23T11:11:06.000Z

Chartbook: Chart GBP/USD: Corrective pullback into the coming weeks

1

The anticipated continuation of September 2022 gains has tested above the 1.3785~ year high of 1 July 2025 to post a fresh 2026 year high at 1.3865/7

The anticipated continuation of September 2022 gains has tested above the 1.3785~ year high of 1 July 2025 to post a fresh 2026 year high at 1.3865/70.

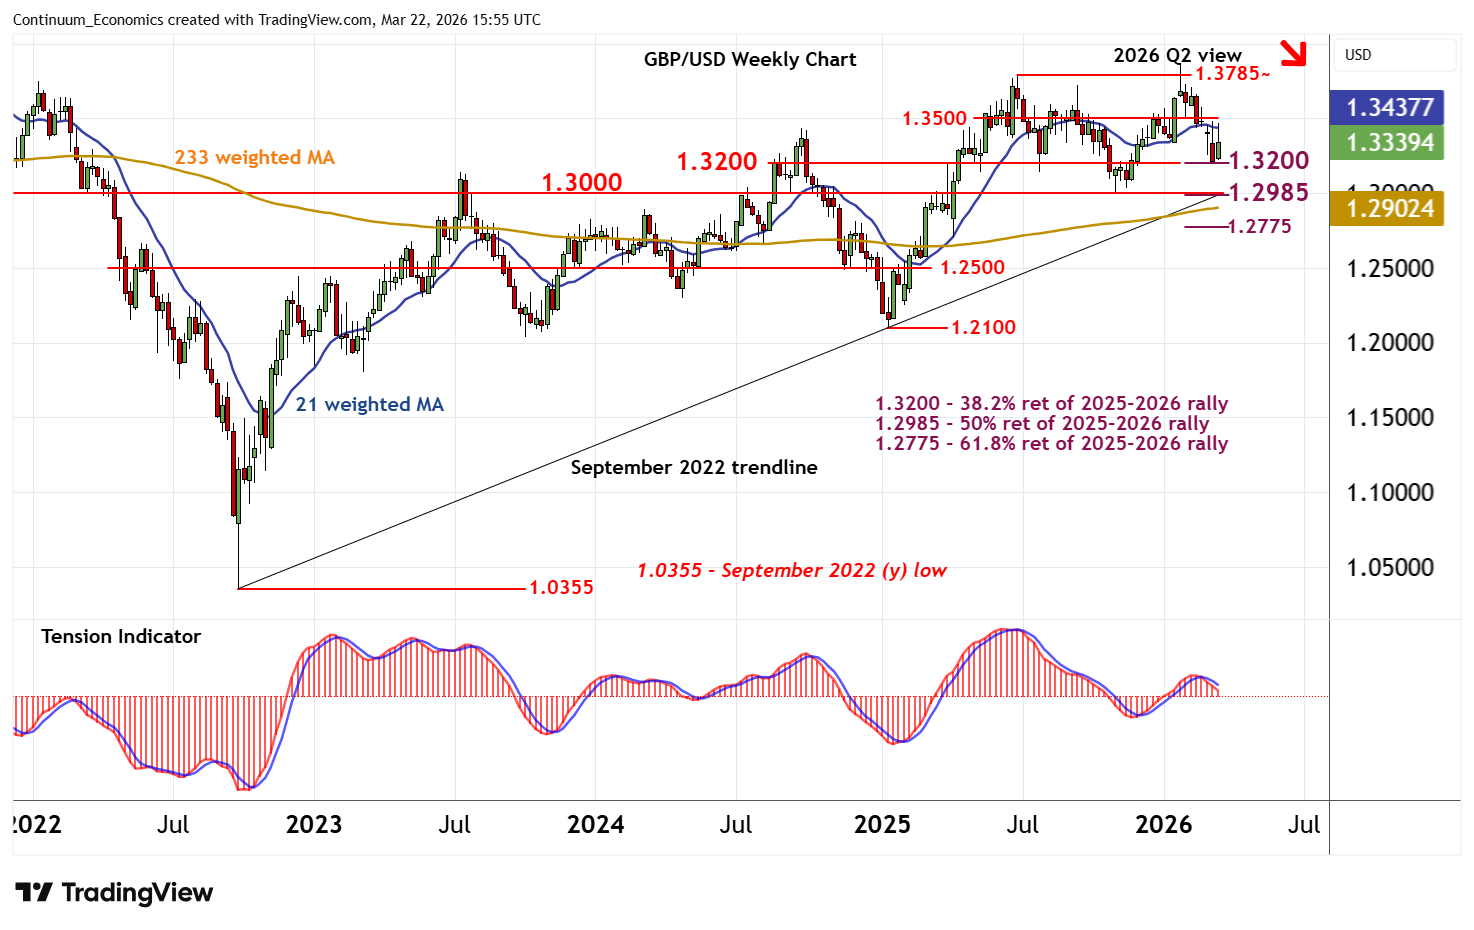
Subsequent selling interest has given way to a break below 1.3500 to reach strong support at the 1.3200 congestion/Fibonacci retracement.

Both weekly stochastics and the weekly Tension Indicator are bearish, highlighting room for a break beneath here, and continuation of January losses towards critical support at the 1.2985 retracement and congestion around 1.3000.

Already oversold weekly stochastics could limit any initial tests of here in consolidation. But negative monthly studies suggest risk of a further break and a deeper correction of multi-month gains.

Meanwhile, resistance is at congestion around 1.3500 and extends to the 1.3785 - 1.3865 highs.

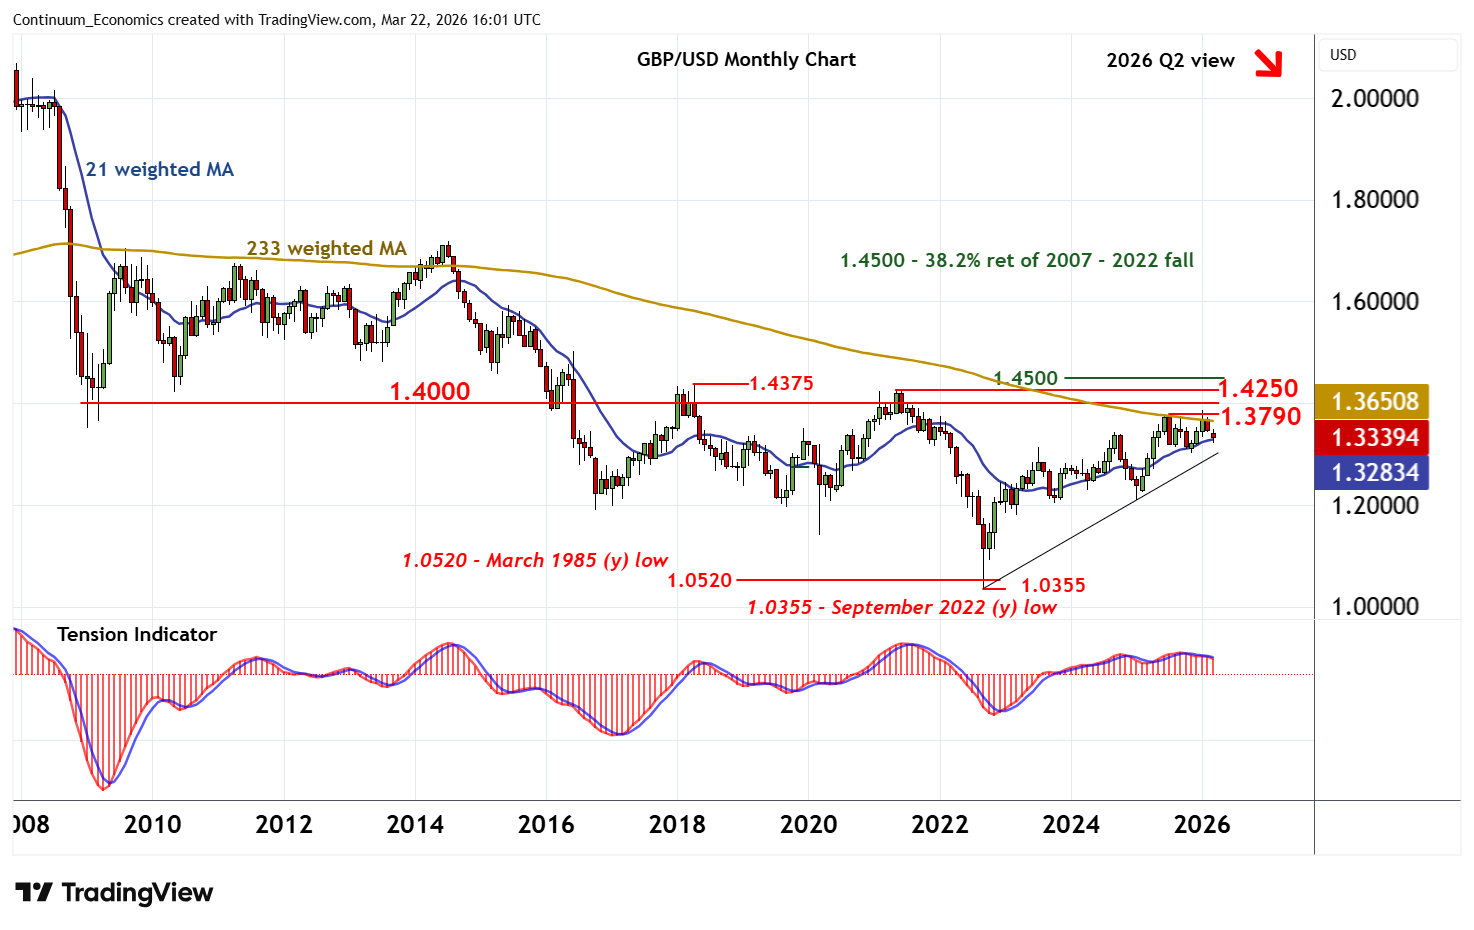
Monthly studies are turning lower, suggesting any immediate tests of this range should be limited in fresh consolidation. A break above here, however, will improve sentiment and extend September 2022 gains towards further congestion around 1.4000 and critical resistance within the 1.4250 year high of June 2021 and 1.4375 multi-year high of April 2018.

From a longer-term perspective, multi-month studies are rising,

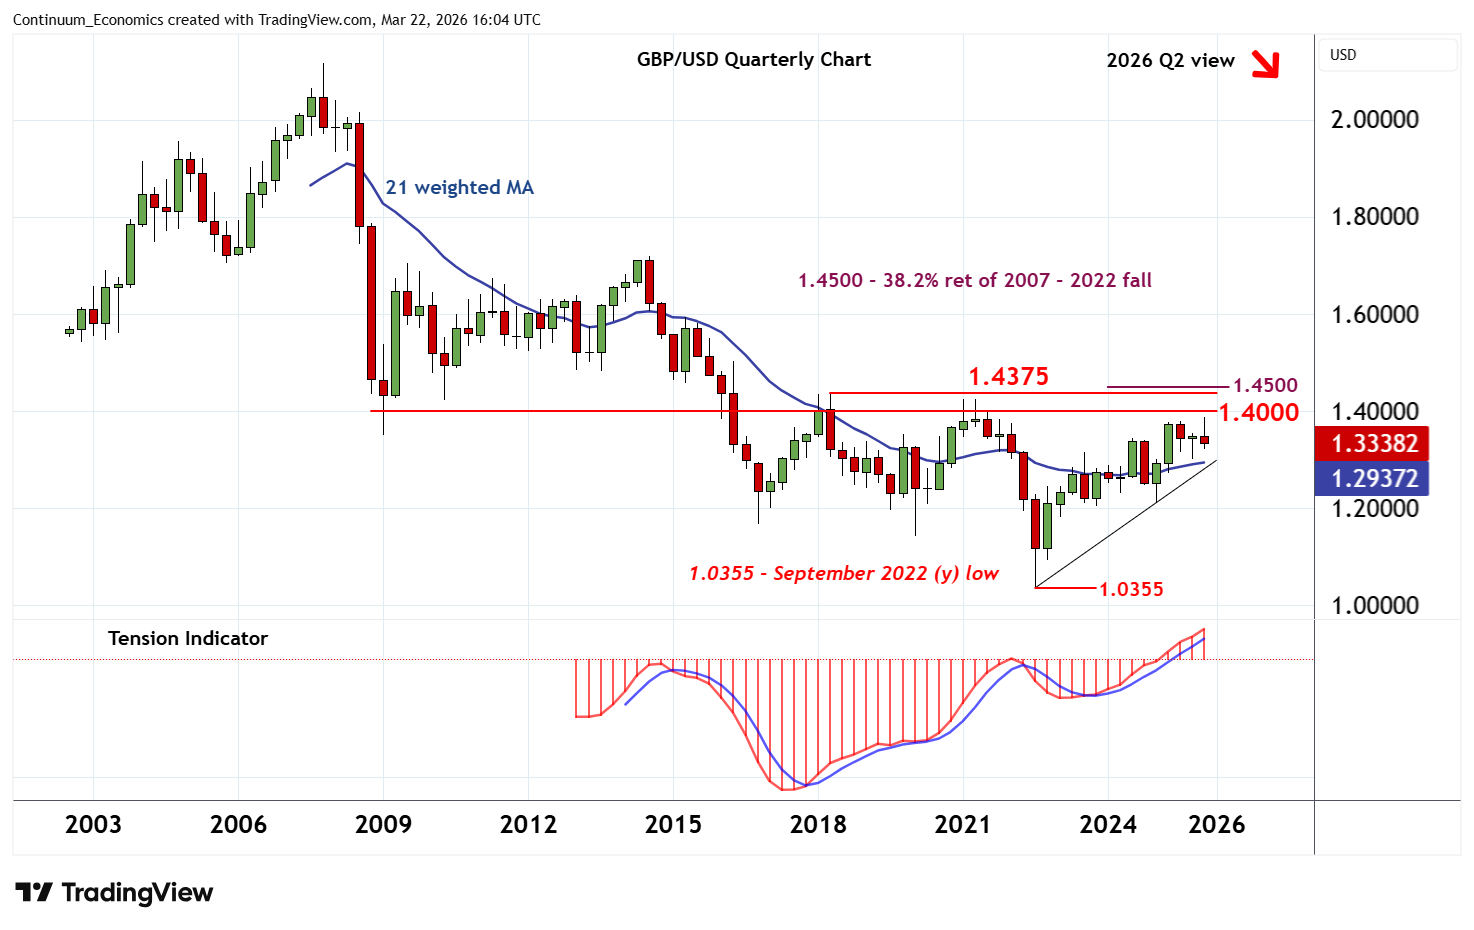
suggesting the current pullback is viewed as corrective.

However, a close above 1.4375 would improve sentiment and open up a test of the 1.4500 multi-year retracement.

Continue to read the article for free
Login

or

or

Topics
Technical Analysis
GBP/USD-TA
ChartBook

GENERAL

  • Home
  • About Us
  • Our Team
  • Careers

LEGAL

  • Terms and Conditions
  • Privacy Policy
  • Compliance
  • GDPR

GET IN TOUCH

  • Contact Us
Continuum Economics
The Technical Analyst Awards Winner 2021
The Technical Analyst Awards Finalist 2020

© 2026 Continuum Economics

image