Published: 31/03/25 at 07:39 UTC
Chart EUR/USD Update: Cautious trade

Senior Technical Strategist
-

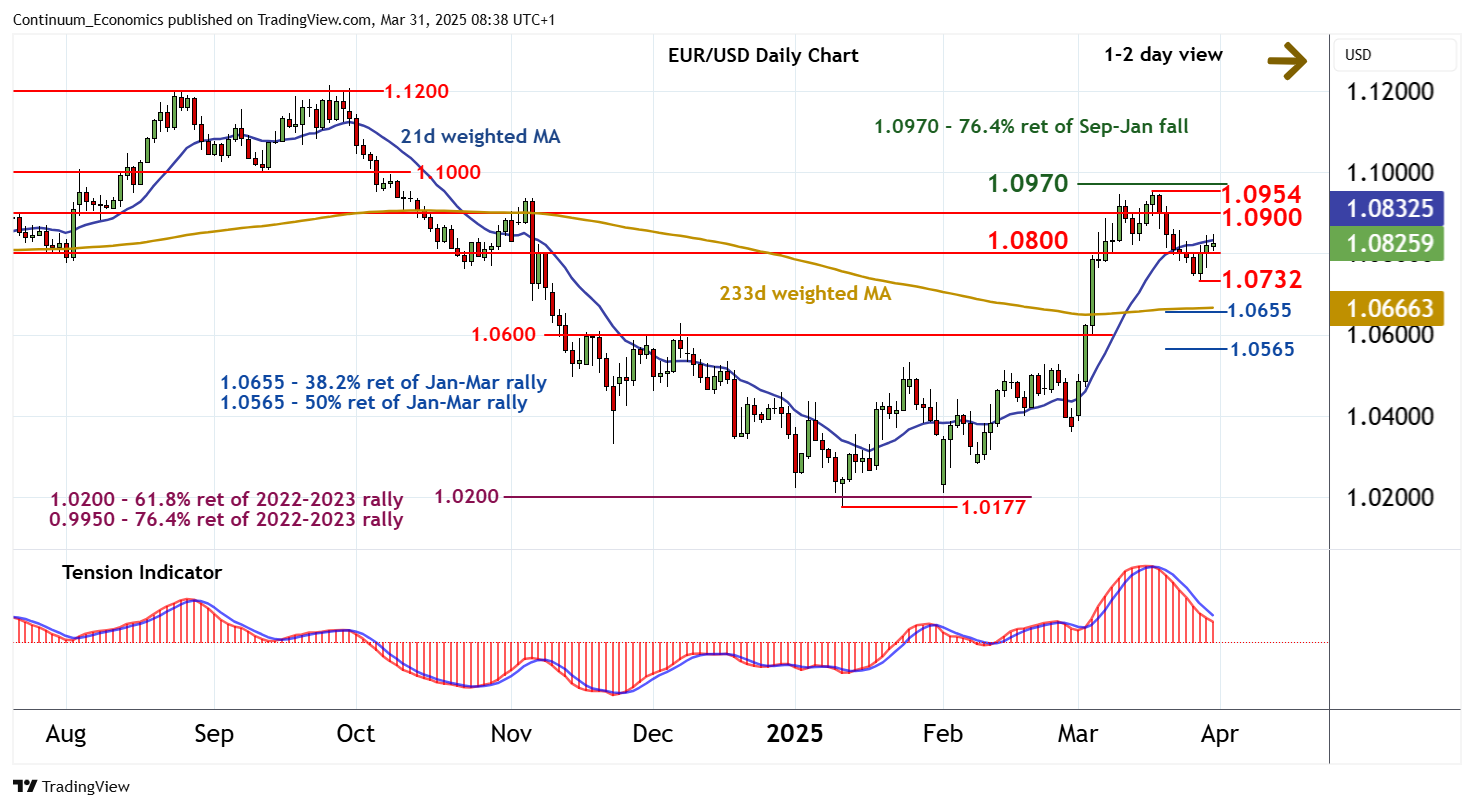
The break back above 1.0800 has reached 1.0830

| Levels | Imp | Comment | Levels | Imp | Comment | |||
|---|---|---|---|---|---|---|---|---|
| R4 | 1.1000 | ** | congestion | S1 | 1.0800 | * | break level | |
| 14 | 1.0970 | ** | 76.4% ret of Sep-Jan fall | S2 | 1.0732 | * | 27 Mar (w) low | |
| R2 | 1.0954 | 18 Mar YTD high | S3 | 1.0655 | ** | 38.2% ret of Jan-Mar rally | ||
| R1 | 1.0900 | * | break level | S4 | 1.0600 | ** | congestion |
Asterisk denotes strength of level
08:30 BST - The break back above 1.0800 has reached 1.0830, where mixed/negative intraday studies are prompting short-term consolidation. Oversold daily stochastics are unwinding, suggesting room for a test of resistance at the 1.0900 break level. But the negative daily Tension Indicator and unwinding overbought daily stochastics are expected to prompt renewed selling interest towards here. Meanwhile, support is at 1.0800. The rising weekly Tension Indicator should prompt fresh buying interest towards here.