Published: 2026-05-14T01:45:07.000Z
Chart GBP/USD Update: Under pressure
3
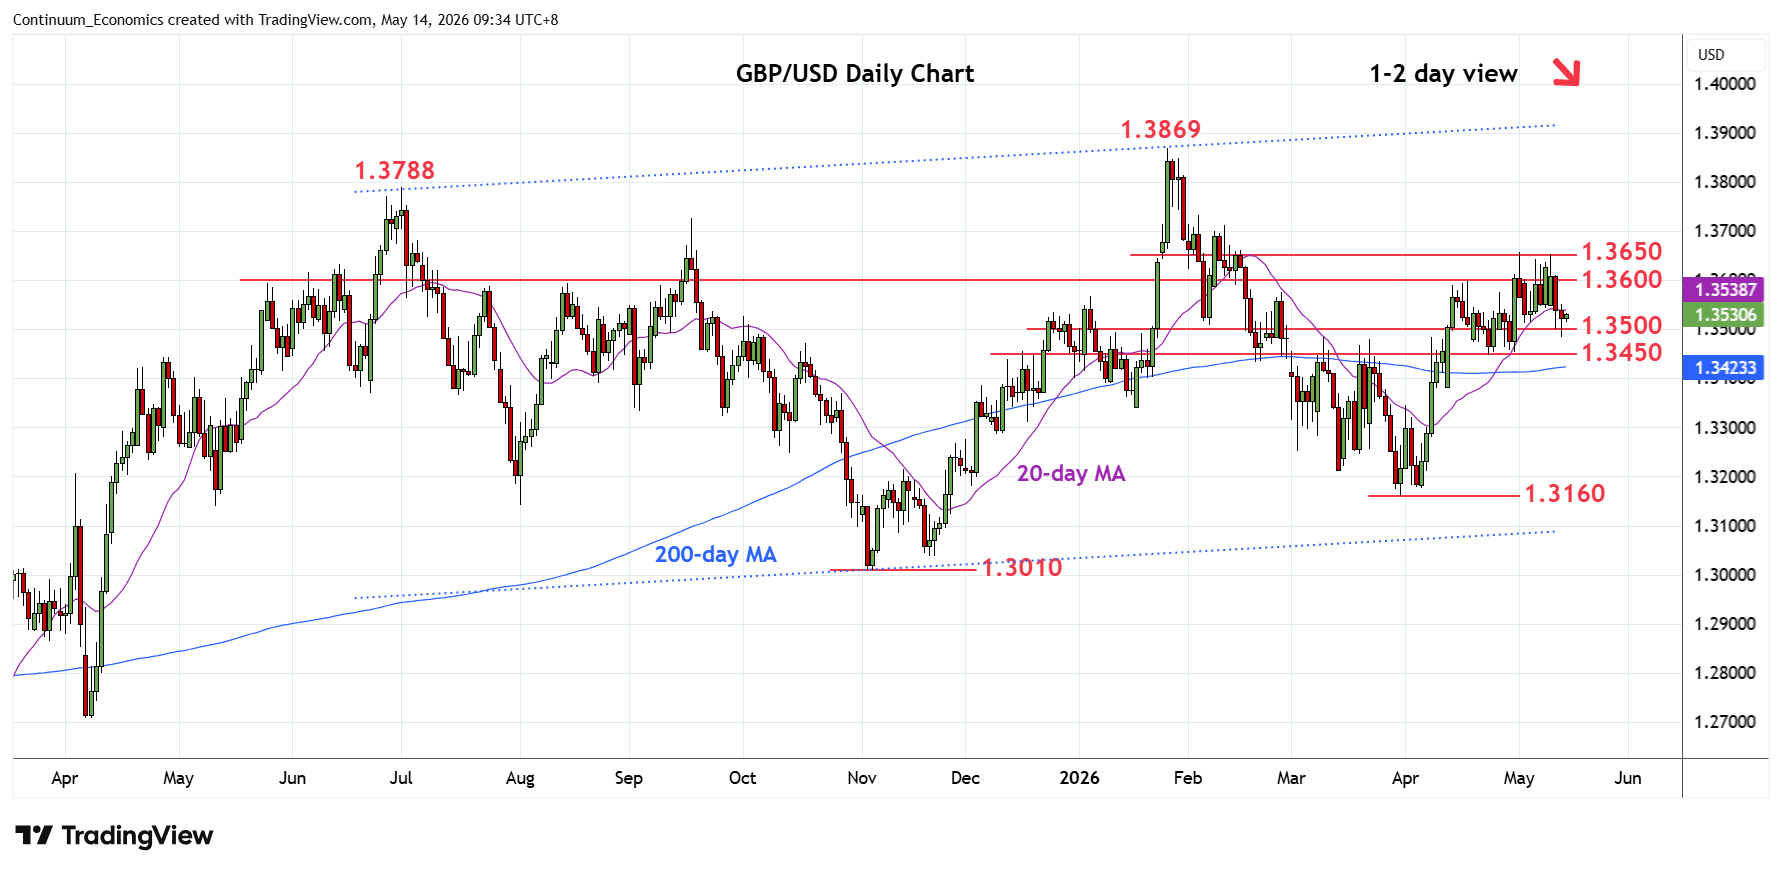
Leaning lower in choppy trade below the 1.3650 resistance to pressure support at the 1.3512/00 congestion area
| Level | Comment | Level | Comment | |||||
|---|---|---|---|---|---|---|---|---|
| R4 | 1.3700 | * | congestion | S1 | 1.3512/00 | * | 4 May low, congestion | |
| R3 | 1.3650/58 | ** | congestion, 1 May high | S2 | 1.3450 | ** | 23 Apr low, congestion | |
| R2 | 1.3600 | * | congestion | S3 | 1.3400 | * | congestion | |
| R1 | 1.3550 | * | congestion | S4 | 1.3350 | * | congestion |
Asterisk denotes strength of level
01:35 GMT - Leaning lower in choppy trade below the 1.3650 resistance to pressure support at the 1.3512/00 congestion area. Negative daily studies suggest scope for break here to expose the 1.3450 low of 23 April to retest. Break here, if seen, will open up room for deeper pullback to retrace gains from the 1.3160, current year low of 31 March. Meanwhile, resistance is lowered to the 1.3550/1.3600 congestion area which is expected to cap and sustain rejection from the 1.3650/58 congestion area and high of 1st May.