Published: 2026-04-10T01:07:55.000Z
Chart USD/JPY Update: Higher in range from 158.00 level
1
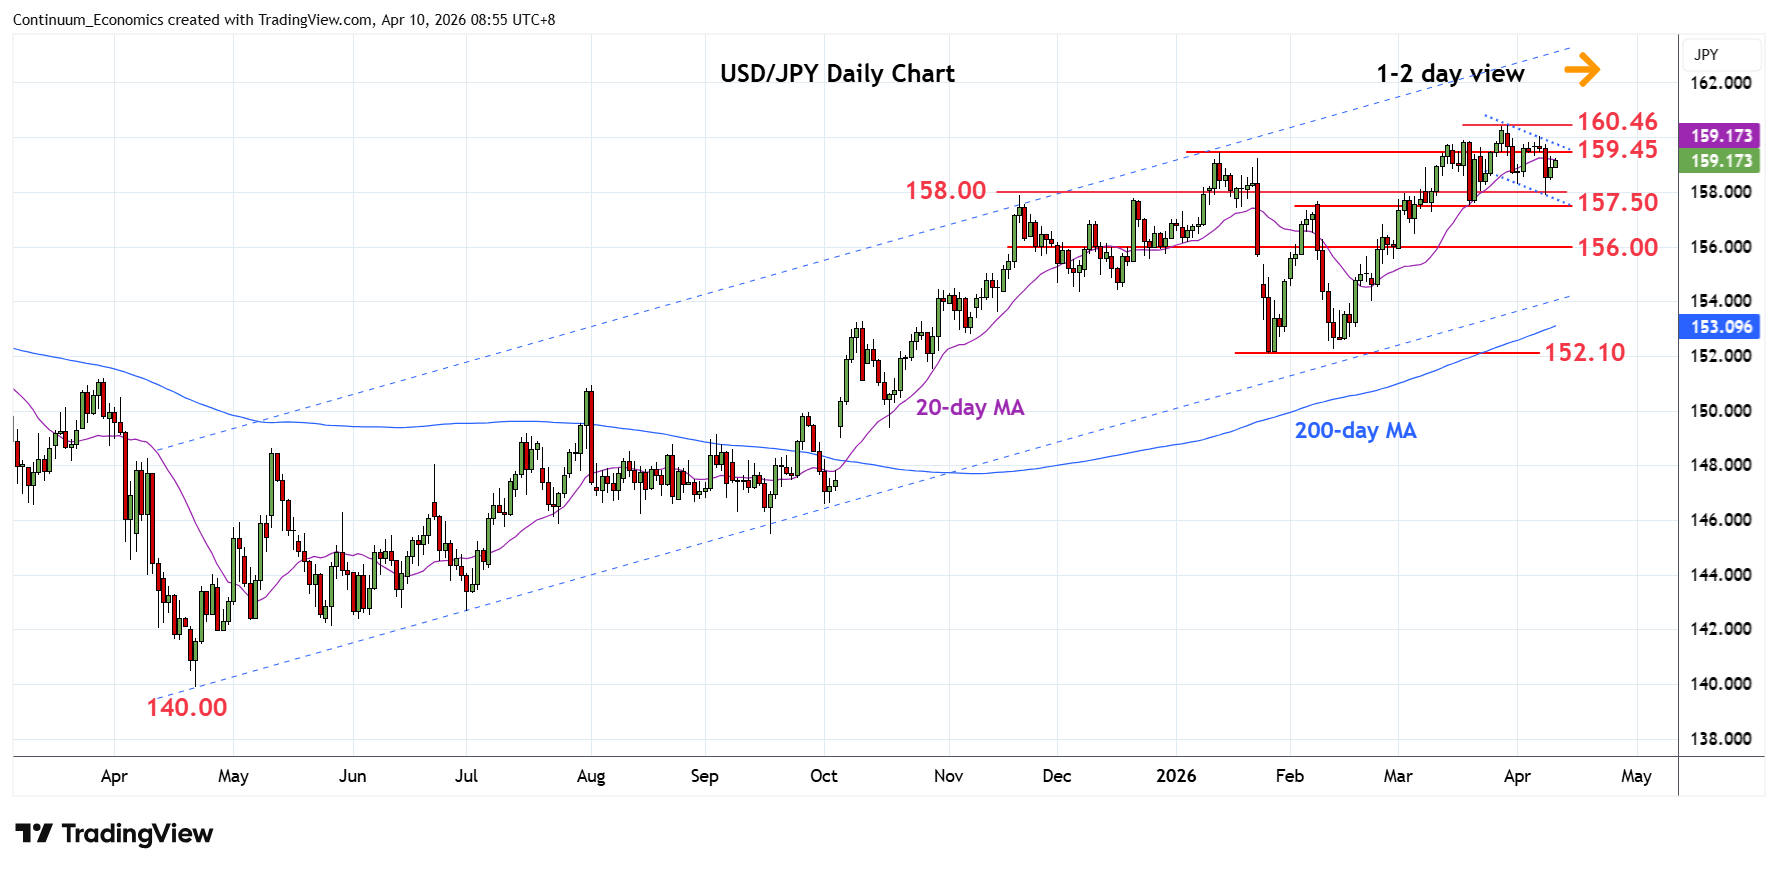
Higher in range following test of the 158.27/00 support as prices unwind oversold intraday studies
| Levels | Imp | Comment | Levels | Imp | Comment | |||
|---|---|---|---|---|---|---|---|---|
| R4 | 161.00 | * | congestion | S1 | 158.27/00 | ** | 1 Apr low, congestion | |
| R3 | 160.46 | ** | 30 Mar YTD high | S2 | 157.50 | ** | 19 Mar low | |
| R2 | 160.00 | * | figure, congestion | S3 | 157.25 | * | 38.2% Jan/Mar rally | |
| R1 | 159.45 | * | Jan high | S4 | 156.50 | * | congestion |
Asterisk denotes strength of level
01:00 GMT - Higher in range following test of the 158.27/00 support as prices unwind oversold intraday studies. Bounce above the 159.00 level sets up scope for retest of resistance at 159.45 January high. However, negative daily and weekly studies suggest this and the 160.00 figure expected to cap and give way to renewed selling pressure later. Consolidation expected to give way to renewed selling pressure later. Break of the 158.00 level will see room to strong support at 157.50, 19 March low. Below this will confirm a top in place at the 160.46 high and further retrace the January/March gains.